


USOIL and UKOIL are some of the most profitable pairs for SimpleFX traders. The trends are strong and can be predicted based on the news. Here’s what our technical analysis says about the nearest future.
The current structure of oil suggests the construction of a large horizontal trend that moves within the green channel.

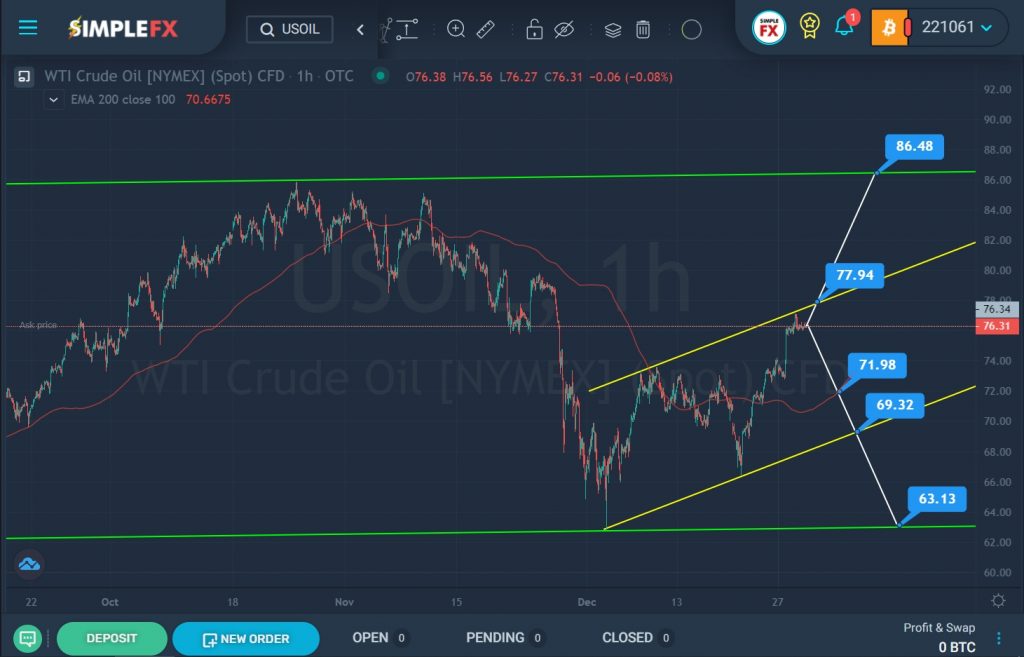
On the current chart, we see that since September and almost all of October, the price has been gradually rising in the direction of the upper green line. At the end of October, the market reached the upper green wall, and then we saw how it pushed off from it and began to rapidly decline to the lower green line.
At the beginning of December, the market reached the lower green line, then we saw a sharp reversal. Since then, the price has been moving in an upward direction within a small yellow channel. It seems that the bulls are aiming at the resistance level of 86.48, located on the upper green wall, however, on their way we see the upper yellow line and the resistance level of 77.94. That is, the bulls first need to break through the yellow line, only then the way will open for them further.
Alternatively, it is assumed that the upper yellow line will not be broken, perhaps the price will begin to fall to the lower yellow line. On the way of the bears, we see the support level of 71.98, which is located on the moving average line. Only at the breakdown of this level, the decline can be continued to the lower yellow wall and the support level of 69.32.
If the bears still have strength left and they can break through the support level of 69.32, then oil prices may fall to the support level of 63.13.


