


The current structure of the USDCHF currency pair assumes the formation of a global uptrend that moves inside a large green channel. The 1H timeframe shows the period of market movement from October to the present day.

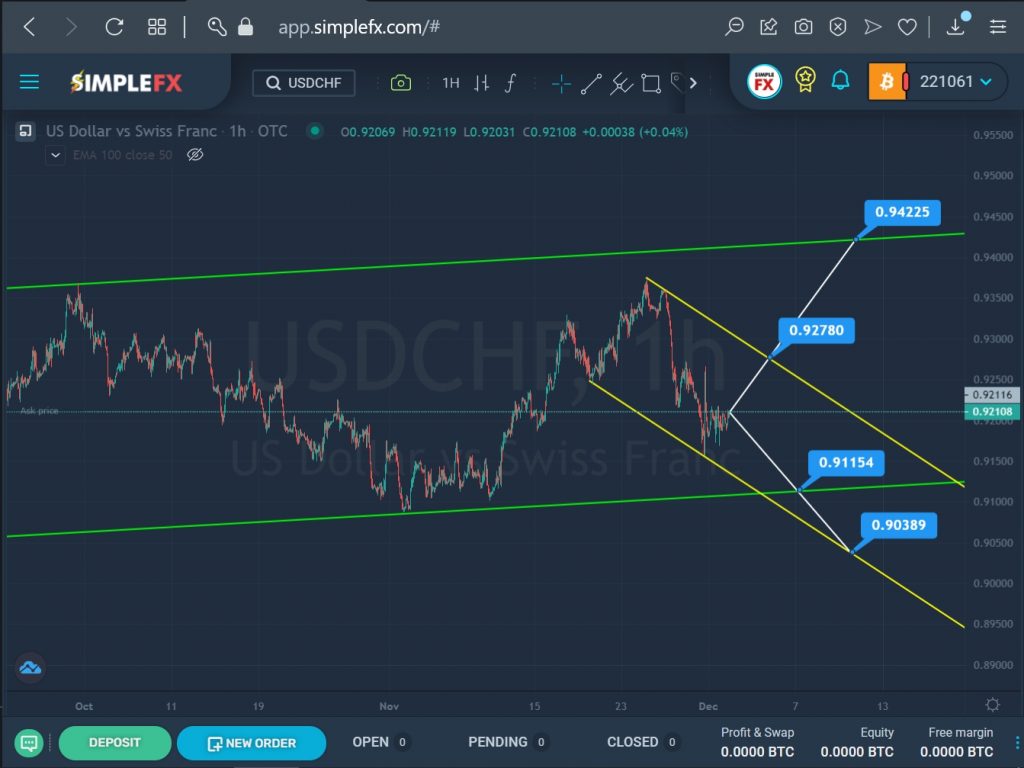
In early November, the price reached the lower green line, then pushed off from it and began to move in an upward direction, but before reaching the upper green line, we saw a reversal of the currency pair. The last section of the chart describes a small yellow channel.
Recently, the price dropped to the yellow support line, but could not break through it. Perhaps, after a slight correction, the bears will lead the market down again. Their target is the support level of 0.911 located on the lower green wall. Bears have no obstacles on the way to this level. And in case of its break, the way will open for the bears to the next important support level of 0.903, which is located on the lower yellow line.
Alternatively, an upward movement of the market is expected in the direction of the resistance level of 0.927, which is located on the upper yellow line. If the bulls are strong enough, there is a chance that the specified level will be broken, which means the price will continue to rise in the direction of the upper green line and the resistance level of 0.942.


