


More than a month ago we talked about EURGBP. The current formation of the EURGBP pair suggests the construction of a large downtrend that moves within the green channel. We see that at the beginning of October, the price, before reaching the upper green line, turned around and the market moved in a downward direction.

At the end of October, the price touched the lower green line, after which it jumped sharply and reached the upper green line in a short period of time. However, after that, it fell to the lower yellow line with the same speed. Until today, the bears have failed to break through the lower yellow line.
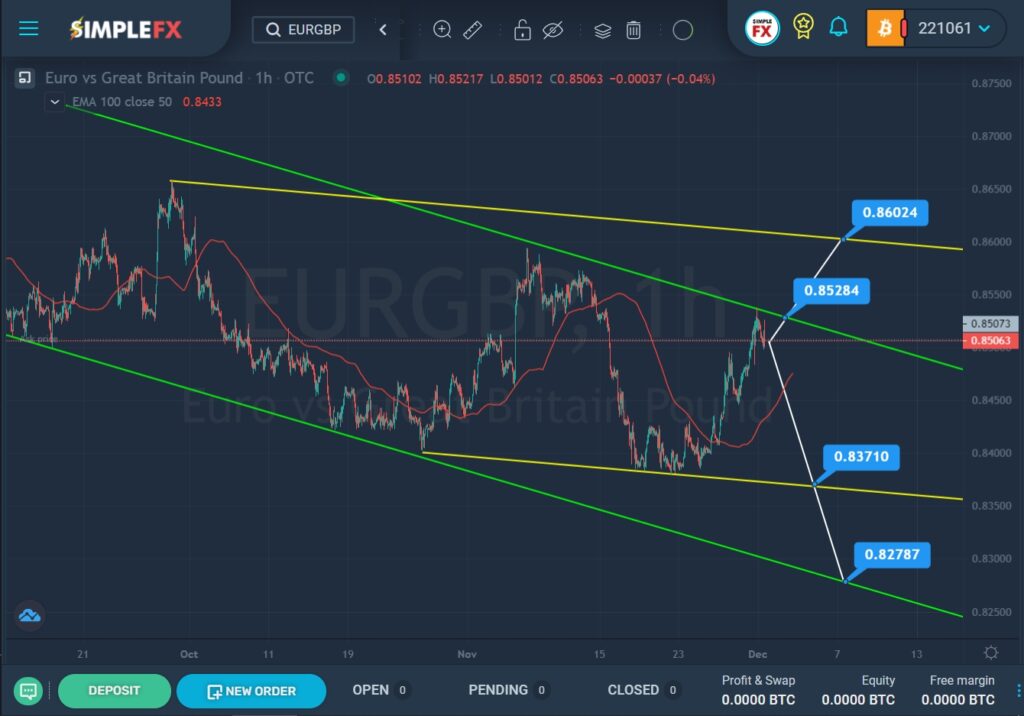
Currently, the price is near the upper green line. If the bulls gather all their strength, then there is a chance that they will be able to break through the resistance level of 0.852. If this level breaks, they will open the way to the upper yellow line and the support level of 0.860.
But there is a possibility that the bulls will not overcome the green resistance line again, so the market may turn around and start to decline. We see a red resistance line on the way of the bears, if the bears break through it, they will have no obstacles left to lead the market to the lower yellow line and the support level of 0.837. With a successful break of this level, the decline may continue to the next important support level of 0.827, which is located on the lower green line.
The approximate scheme of the price movement of these two options is shown in the chart.


