


For the SPX500 stock index, we see the construction of a large bullish trend that moves inside the green channel. Since the second half of October, the price has rapidly jumped to the upper green line. This period describes a small ascending channel of yellow color.

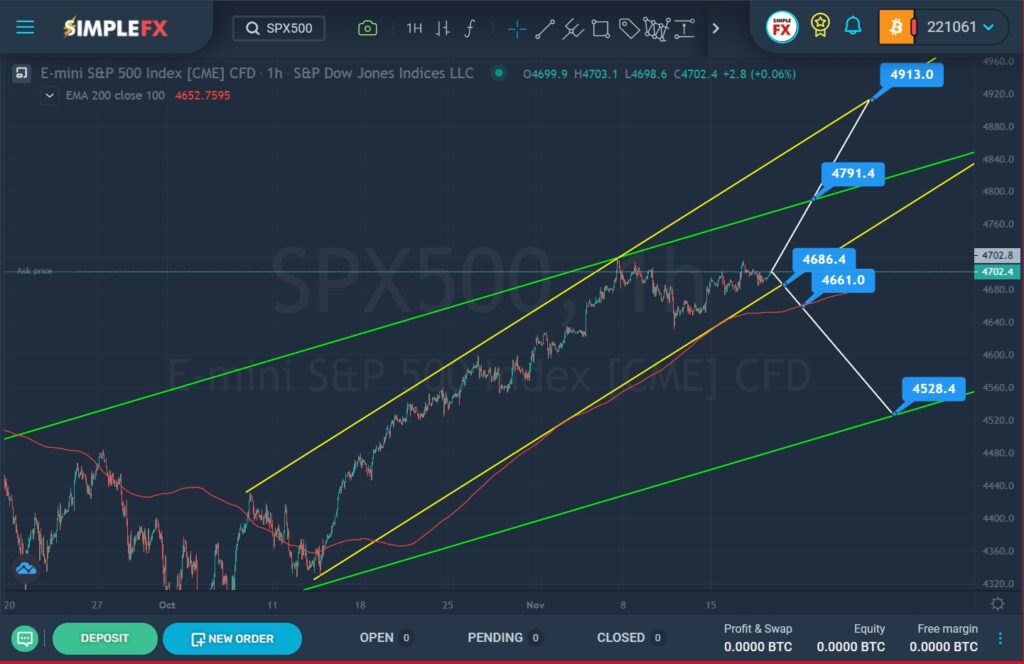
SimpleFX SPX500 Chart Analysis: November 18, 2021
We see that on November 8, the price reached the upper green line at the intersection with the upper yellow line, then pushed off and began to move up. It is possible that a small correction has formed in the market, so the growth will continue in the near future.
Thus, there is a possibility that the price will rise again to the upper green line. If the resistance level of 4791.4 breaks, which is located on the green wall, the index rate may jump to the price level of 4913.0, which is located on the upper yellow wall.
Alternatively, it is assumed that the bulls weakened and gave up their positions. So bears now have every chance to take over the market. The first target the bears are aiming at is the support level of 4686.4, which is located on the lower yellow wall.
If the lower line of the yellow channel and the support level of 4686.4 are broken, a path will open for the bears to the lower line of the green channel and the support level of 4528.4. Confirmation that a long decline to the lower green line has really begun will be the break of the support level of 4661.0, which forms the red line of the moving average.
It should be borne in mind that the downward movement will occur against the slope of the ascending green channel, this may restrain the bears, slowing down the decline. Therefore, if the market breaks through the lower yellow wall and the moving average line, the downward movement may develop gradually and not too quickly.


