


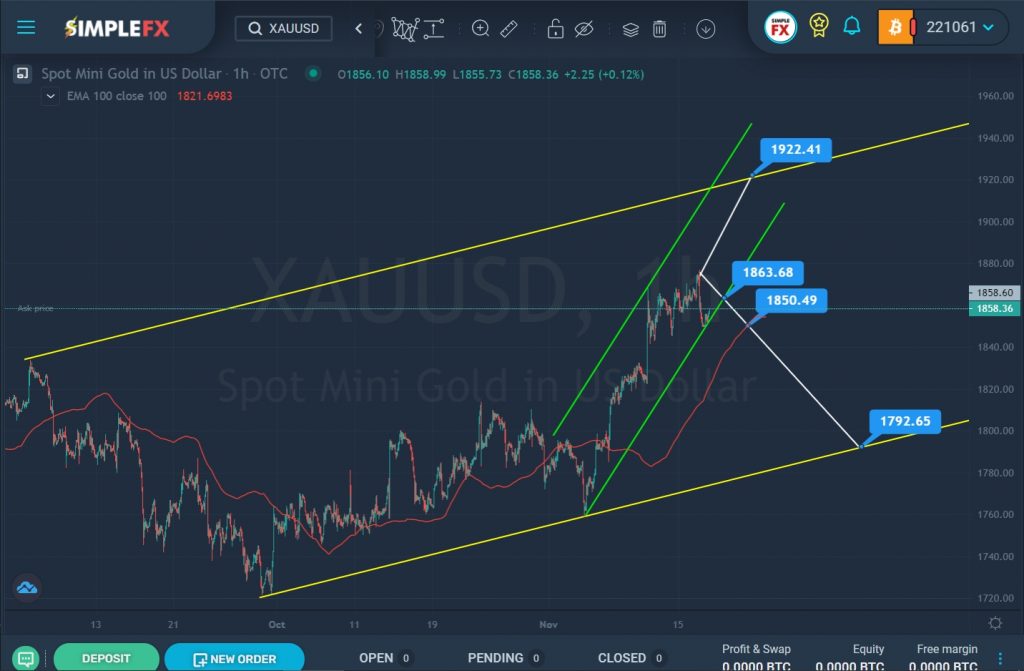
For the XAUUSD pair, we see the development of an uptrend, which is formed inside a large yellow channel. In the last section of the chart, we see an upward price movement inside a small green channel, which began in early November.

SimpleFX XAUUSD Chart Analysis: November 17, 2021
Since the beginning of November, we can see that bulls lead the market and, most likely, in the short term, the market growth will continue in the green channel towards the upper yellow walls and resistance level of 1922.41.
However, on such a dramatic upward trend, the market may take some time to puncture the bottom green line and then continue its upward movement. To eliminate the possibility of a false break, a red moving average line was added as a confirmation signal that the downtrend to the lower yellow wall has already begun. If we see a break of the lower green line, then a decline to the support level of 1850.49, which forms the red line of the moving average and subsequently the bears will be able to break through this level, there will be no obstacles for them and the path to the lower line of the yellow channel will be open.
When confirming the bullish movement, it is worth considering opening deals for purchases. When confirming a bearish movement, it is worth considering opening short positions.


