


For the main cryptocurrency pair LTCUSD, we see the formation of a global uptrend, which moves within two channels: green and yellow.

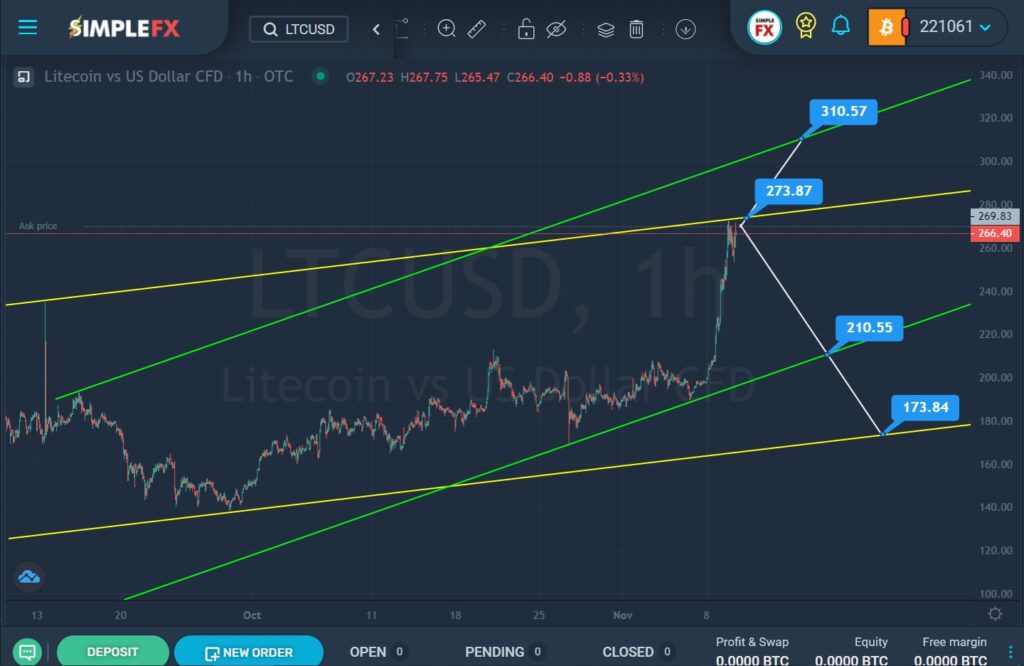
We see that at the end of September, the bears reached the lower yellow line, but did not break through it and continued to move in the lower areas of the two channels. At the end of October, we saw a couple of attempts to break through the lower green line, but the bears finally gave up and the bulls entered the market. We saw a sharp jump in the market from the lower green line to the upper yellow line. Most likely, in the near future, the bulls will break through the resistance level of 273.87, which is located on the upper yellow wall, and then continue moving to the next important resistance level of 310.57, which is on the upper line of the green channel.
Alternatively, a situation is considered where the bulls do not have enough strength to break through the upper yellow wall. In this case, the market may turn around and go down in the direction of the lower green line and the support level of 210.55. With a successful break of this price mark, the bears will have a clear path to the lower yellow wall and the support level of 173.84.
In the first option, you may consider opening long positions, and if the second option is confirmed, then it is worth considering opening sales transactions.


