


The BMW.DE stock chart shows a global bullish trend that moves within a large green channel.

At the beginning of June, we saw how the price pushed off from the upper green line and smoothly began to descend down to the lower green line. At the end of August, the price reached the lower green wall, after which it pushed off from it and began to move in the opposite direction.
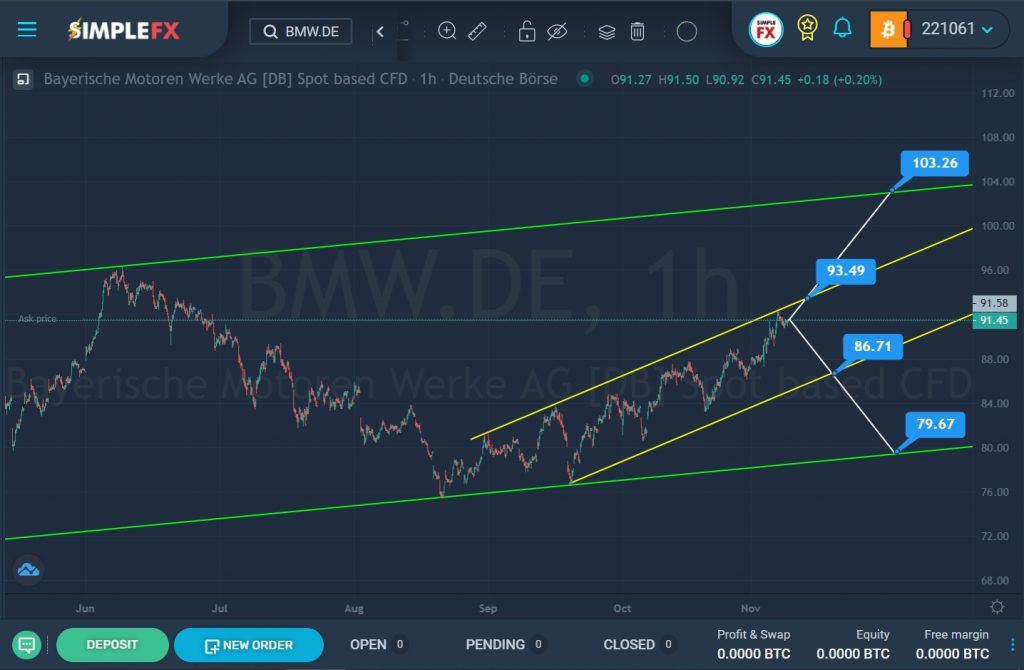
In mid-September, the bears tried to conquer the market, but when they reached the lower green line, they retreated again. From that moment to the present day, we have observed a smooth increase in the price within a small yellow channel. Now the price is near the upper yellow line. There is a possibility that the bulls will break through the resistance level of 93.49, and then start pushing the price in the direction of the resistance level of 103.26, which is located on the upper green line. If this scenario is confirmed, the opening of long positions can be considered.
Alternatively, a downward movement of the market is expected. That is, if the bulls fail to break through the first resistance level, the price will push off from the upper yellow line and start moving towards the support level of 86.71, which is located on the lower line of the yellow channel. If the bears break through the support level of 86.71, a path will open for them to the lower line of the green channel and the support level of 79.67. In this case, we can consider opening short positions.


