


The current structure of the main BTCUSD cryptocurrency pair suggests the formation of a global uptrend that moves inside a large green channel.

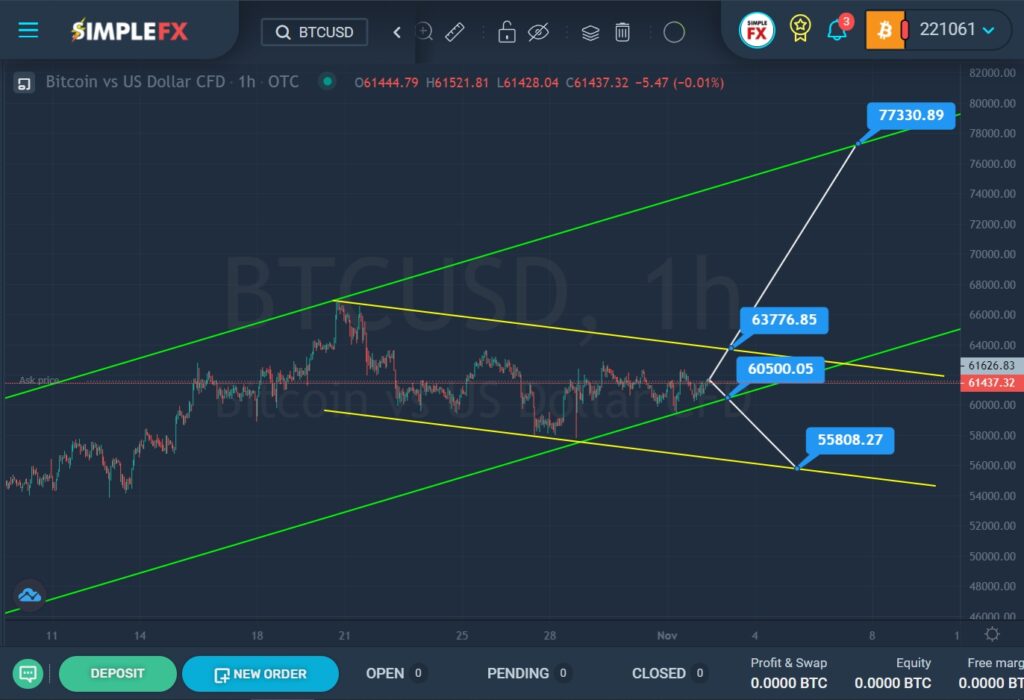
SimpleFX BTCUSD Chart Analysis: November 2, 2021
On the current chart, we see the price movement over the last month. At the beginning of October, the price moved smoothly upwards in the upper green area, then on October 21, the market reached the upper green line and pushed off from it. After that, in just a week, the price plummeted to the lower green line. This period describes a small descending channel of yellow color.
Currently, the price is near the lower green line. It seems that the bears are full of strength, so we can expect a break of the lower green wall near the support level of 60500.05. In this case, a path to the lower yellow wall and the support level of 55808.27 will become available for bears.
Alternatively, a bullish price move is expected, as the bears have already tried to break through the lower green line, however, they failed. In this case, the bulls can reach the first yellow line and the resistance level of 63776.85. With a successful break of this level, we can expect a more rapid growth to the next important resistance level of 77330.89, which is located on the upper line of the green channel.


