


The current formation of the GBPAUD currency pair suggests the construction of a large downtrend that moves within the bearish green channel. During the last month, the price has been moving from the upper green line towards the lower green line. The last section of the chart describes a small descending channel of yellow color.

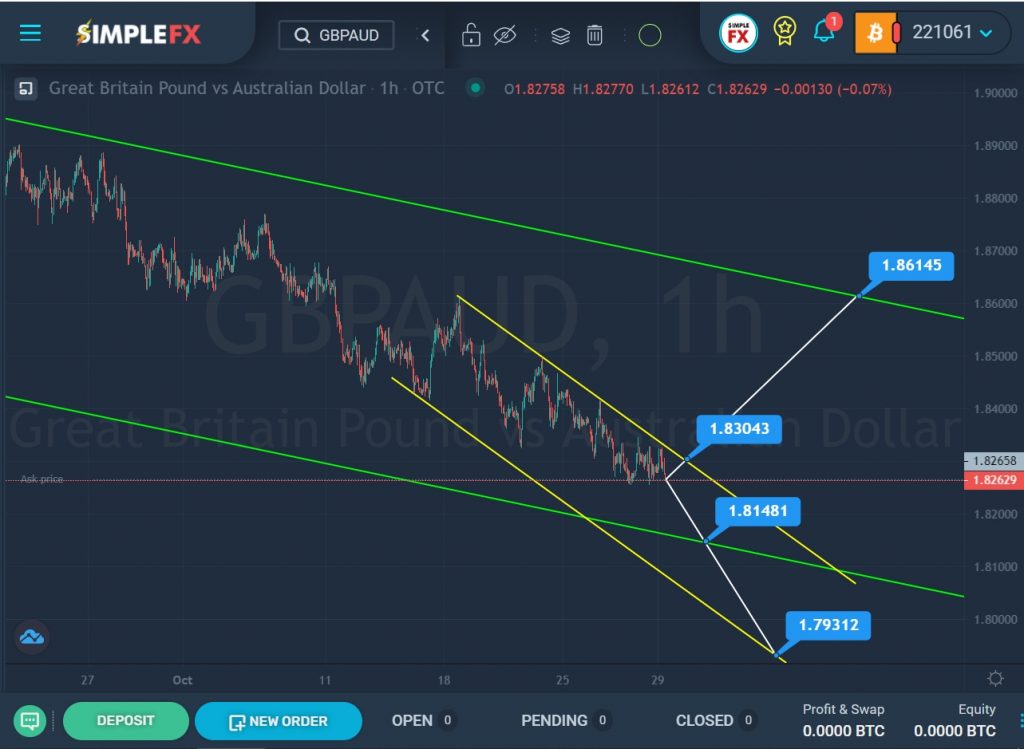
SimpleFX GBPAUD Chart Analysis: October 29, 2021
We are currently near the upper yellow line. Bulls should have no trouble breaking through the resistance level of 1.830, which is located on the upper yellow wall. With a successful break of this price level, market participants can expect the continuation of the bullish trend towards the upper green line and the resistance level of 1.861.
An alternative scenario indicates continuing the decline to the lower green line. Perhaps the bears are targeting the support level of 1.814 which is on it. If the bears manage to break through this price level, then a path will open for them to the lower yellow wall and the resistance level of 1.793.
In case of confirmation of a bullish trend, it is recommended to consider opening long positions from the current level. If the currency pair moves according to the second scenario, that is, in a downward direction, then it is recommended to consider opening sales transactions.
Thank you all for your attention. We will continue to monitor the currency pair further.


