


We are entering an exciting time for oil, gas, and other commodities. The global demand for oil is surging, but a lot depends on the supply side. Let’s take a look at what technical analysis suggests.

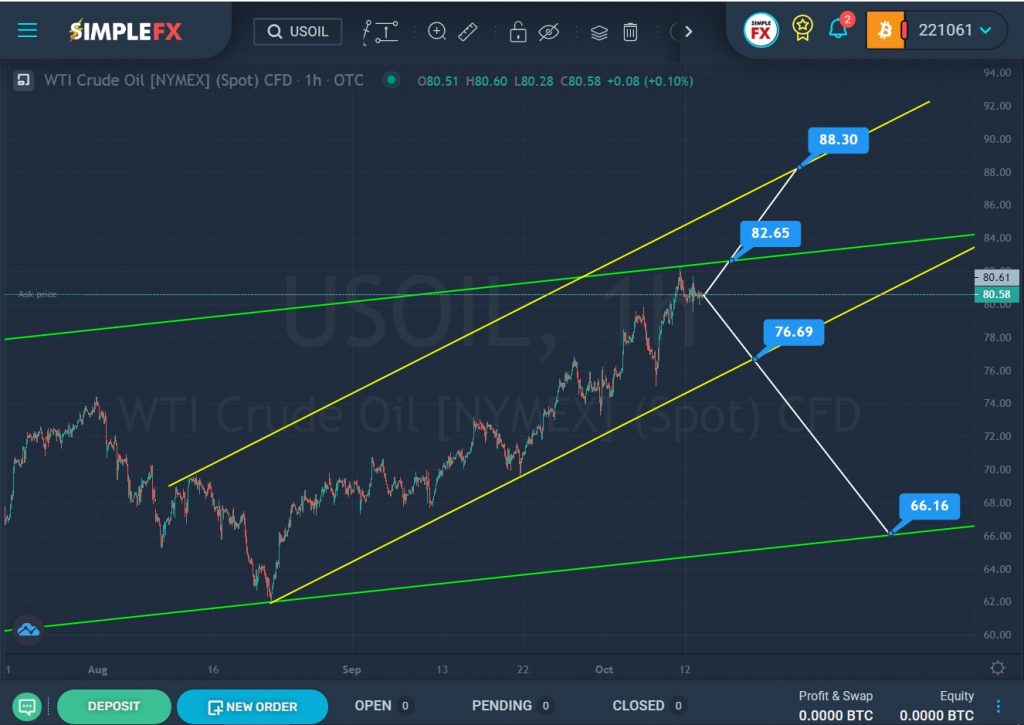
The current structure of oil suggests the construction of a large uptrend that moves within the green channel.
In the second half of August of this year, the price touched the lower green line, but did not break through it, but pushed off from it and began to gradually grow in the direction of the upper green line within a small yellow channel.
Recently, the price reached the upper green wall. The bulls did not have enough strength to break through the green line the first time, so there is a chance that they will start pushing the price up again. If the resistance level of 82.65 breaks, the way will open for the bulls to the next important resistance level of 88.30, which is on the upper yellow line.
Alternatively, it is assumed that the bulls have lost their positions, so the bears have every chance to lead the market. Their first target is at the support level of 76.69, which is on the lower yellow wall. If this level breaks, the oil price may fall even lower – to the support level of 66.16, which is on the lower line of the green channel.


