


Oil prices breaking $81 were one of the reasons why SPX500 failed to break the critical resistance yesterday. Today we are going to witness a critical trading session. Take a look at our analysis before the US markets open.
Meanwhile, gold prices remain low, which may be a sign of a long-term weakness or a silence before a bullish storm.

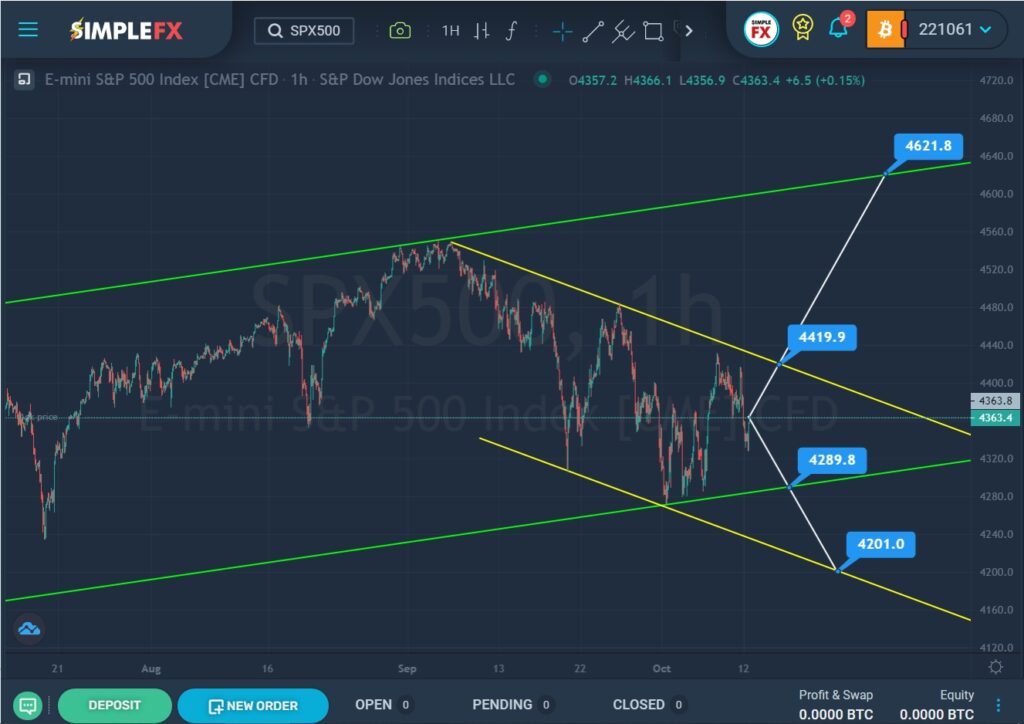
According to the SPX500 stock index, we see the construction of a large bullish trend that moves inside the green channel.
In the first half of September, the price reached the upper green wall, then began to actively go down within the yellow channel. We are currently in the lower green area and in the center of the yellow channel. Perhaps the market will continue to move down and will soon reach the support level of 4289.8, which is on the lower green line. With a successful break of this level, the price may continue to fall to the support level of 4201.0, which is on the lower yellow line.
Alternatively, an upward movement of the market is assumed. If the bulls reach the resistance level of 4419.9, which is on the upper yellow wall, and then break through it, then a path will open for them to the upper green line and the resistance level of 4621.8.

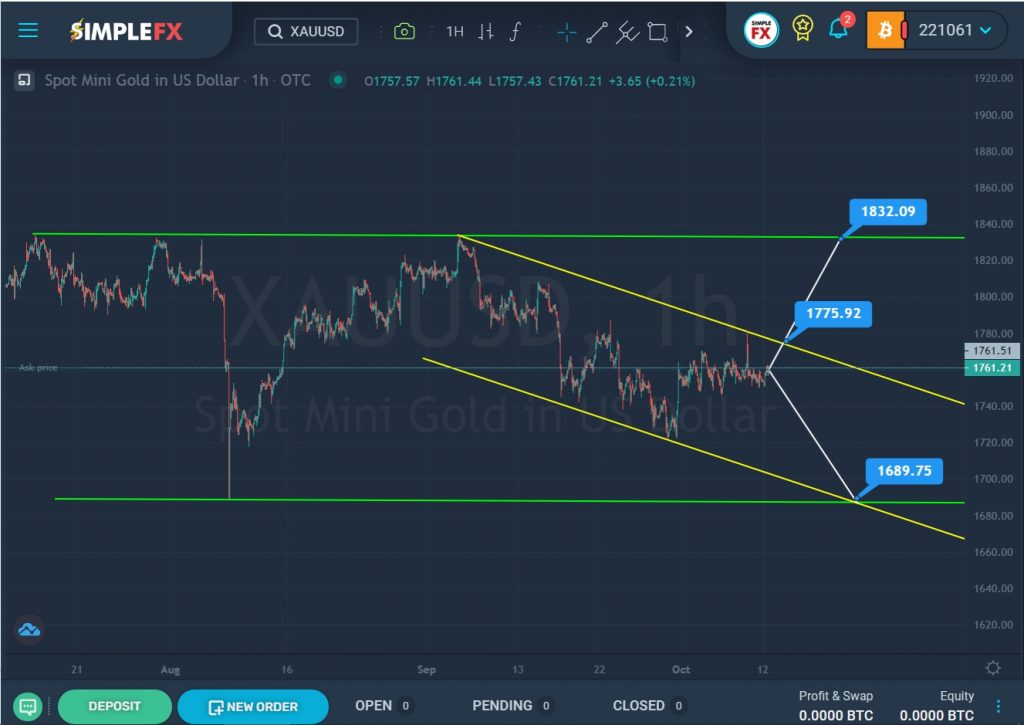
For XAUUSD, we see the development of a horizontal trend, which is formed inside a large green channel. On the chart, we see a downward price move inside a small yellow channel, which began in early September.
Since the beginning of October, the price has increased from the lower yellow wall to the upper yellow wall. Perhaps the bulls are strong enough and have taken the initiative, so in the near future, a break of the resistance level of 1775.92 is possible, after which the pair can rise to a higher resistance level of 1832.09, located on the upper green wall.
If the bulls do not have enough strength to break through the upper yellow wall, then bears will enter the market. Then market participants are waiting for a downward price move in the direction of the lower green line and the support level of 1689.75. At that level, the lower lines of the two channels intersect.


