
After unexpected rate cuts last week the Turkish lira hit a historic record against majors. Our technical analysis suggests the trend may continue, however at this level some investors may see the currency attractive at a discount price. Nevertheless, USDTRY continues to soar.
In the second part of our analysis, we examine the NEOUSD. The cryptocurrency is also having bad times, as we wonder what support levels are coming next for the pair.
SimpleFX USDTRY Chart Analysis: September 28, 2021
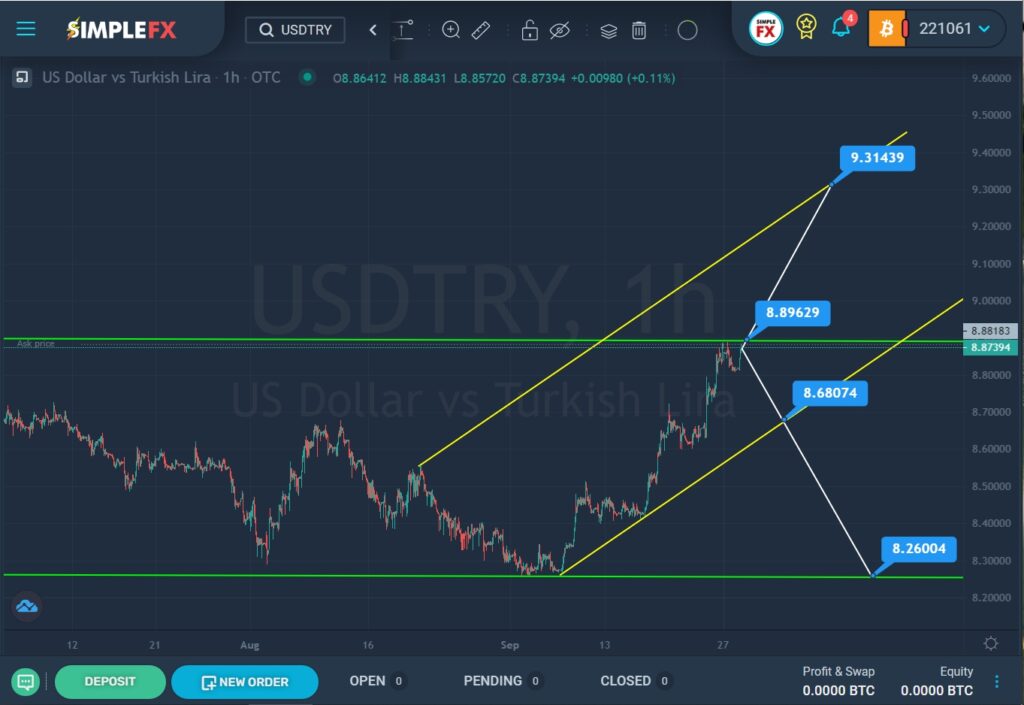
Most likely, for the USDTRY pair, we see the construction of a sideways trend that moves within the horizontal green channel with a downward slope.
In the last section of the chart, we see that the price touched the lower green line, after which it began to move up within the ascending yellow channel. The price has grown quite quickly over the past month and now it is near the upper green line. It is assumed that soon the bulls will break through the resistance level of 8.896, after which the market growth will continue to a higher resistance level of 9.314, which is on the upper yellow wall.
If the bulls do not have enough strength to break through the green wall, then the price will push off from it and begin to fall in the direction of the lower yellow wall and the support level of 8.680. With a successful break of this price level, market participants can expect a decline in the pair to the lower green line and the support level of 8.260.
SimpleFX NEOUSD Chart Analysis: September 28, 2021
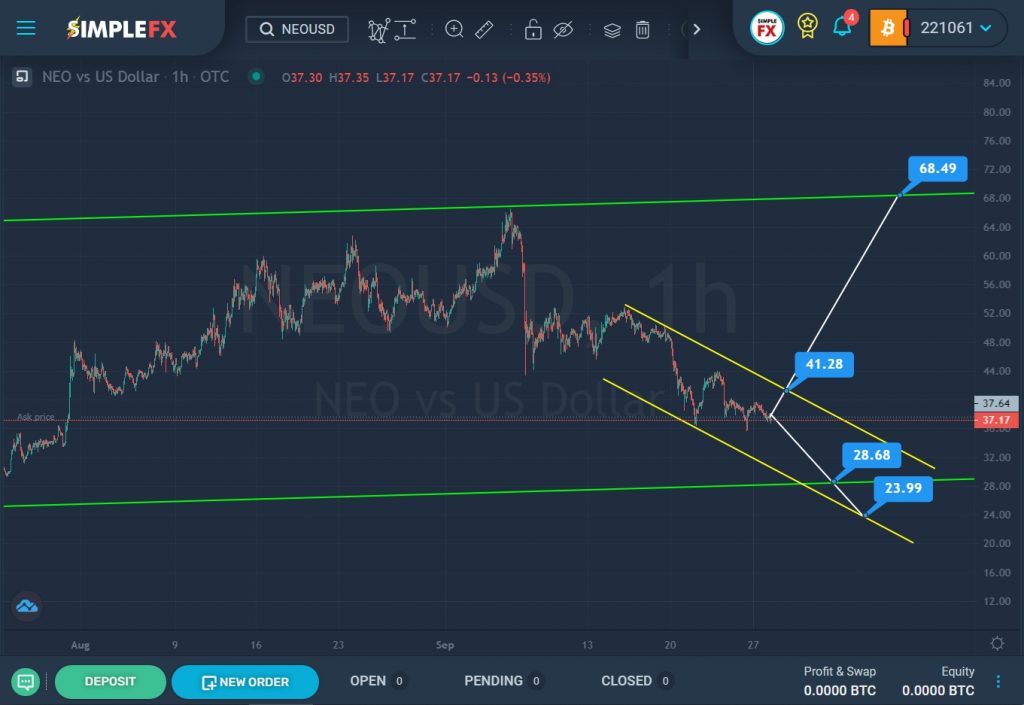
For the NEOUSD cryptocurrency pair, we see the formation of a large uptrend, which moves within the large green channel.
For a long time, the price grew from the lower green wall to the upper green wall. Not so long ago, we saw how the bulls, having reached the upper green line, weakened their positions and gave way to the bears. Over the past two weeks, the NEOUSD pair has been moving down within a small yellow channel.
There are two possible scenarios. In the first case, the bearish price move is expected to continue to the lower green wall and the support level of 28.68. If this price level breaks, the decline can be continued to the lower yellow line and the support level of 23.99.
In the second case, we expect the market to grow to the resistance level of 41.28, which is on the upper yellow line. With a successful break of this level, the bulls can start pushing the market to a higher resistance level of 68.49, which is on the upper green line.