
NYSE took a hit after Chinese developer giant Evergrande took a deep dive on Monday, hitting an 11-years low. Is it an opportunity to buy low or should you short stocks? Let’s take a look at technical signals on the 1-hour DJI30 chart.
Forex markets also reacted to the event. We analyze EURJPY, which seems to be one of the most intriguing pairs this week.
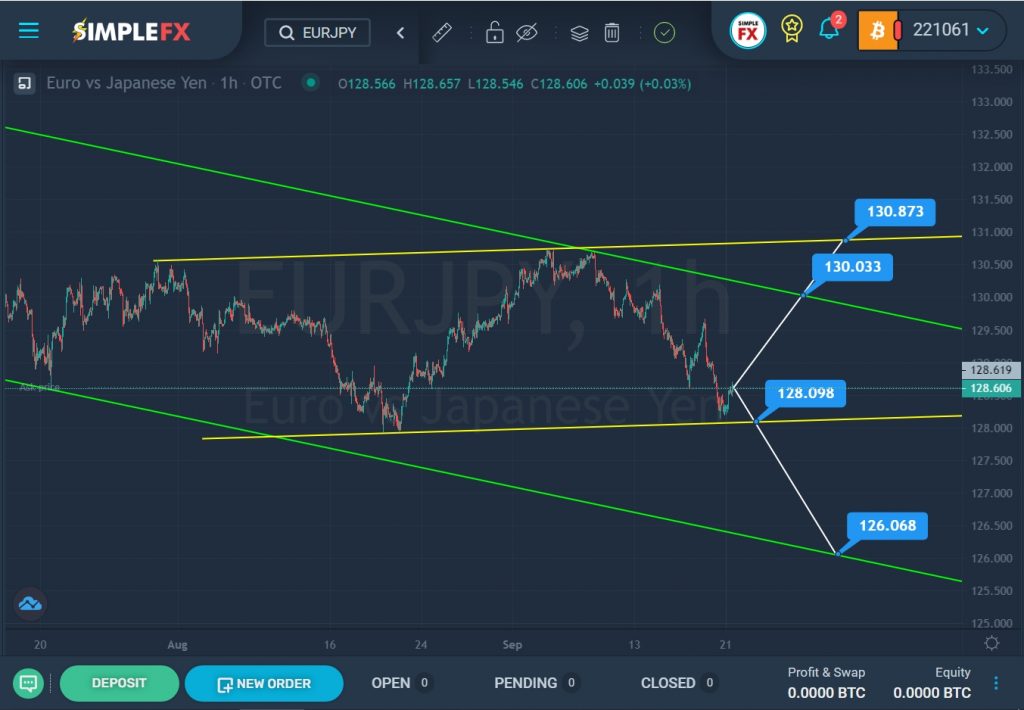
SimpleFX EURJPY Chart Analysis: September 21, 2021
The formation of the EURJPY pair suggests a downtrend that moves within a large green channel. However, there is a possibility that the formation of an uptrend that moves inside the yellow channel began in August.
In the last section of the chart, we see that the price pushed off from the upper walls of the two channels and began to move down. Currently, the price is near the lower yellow line, so there is a chance that the bears will continue to lead the market. If the support level of 128.09 is broken, the bears will open the way to the lower green line and the support level of 126.06. Thus, the bearish trend will be confirmed.
If the uptrend continues to form, the market will move in an upward direction to the upper green wall. If the resistance level of 130.03 breaks, the price will continue to rise to the resistance level of 130.87.
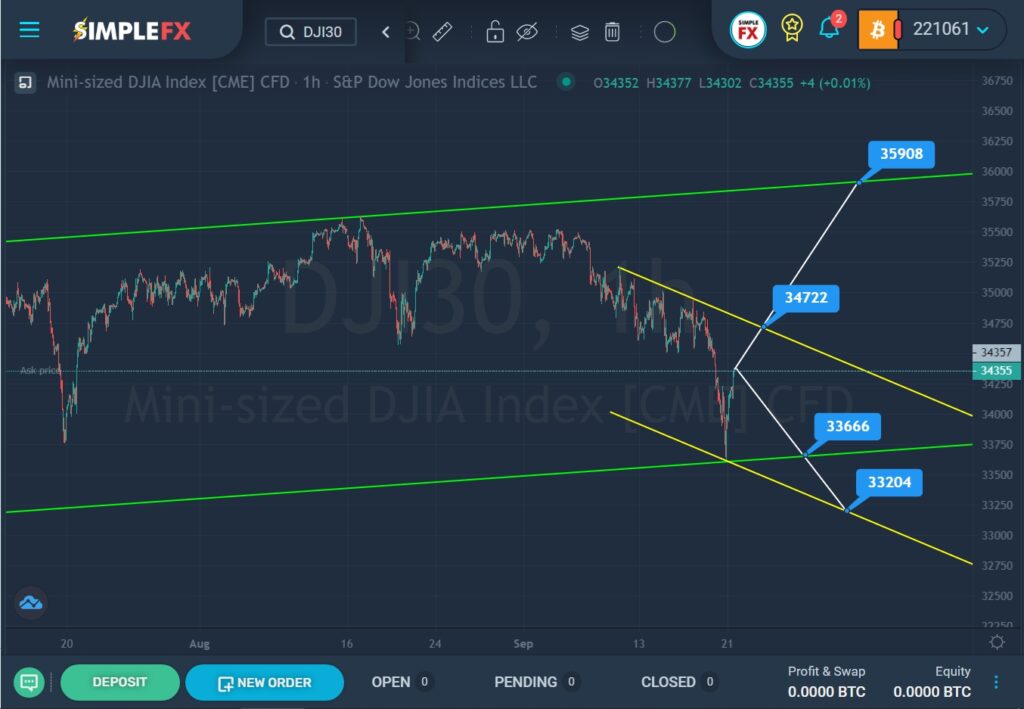
SimpleFX DJI30 Chart Analysis: September 21, 2021
The current DJI30 structure suggests the formation of an uptrend that moves inside the green channel.
In mid-August, the market reached the upper green line, and then pushed off from it. Currently, we see that the price is already near the lower green line. This section describes a small yellow channel. Perhaps, after a small pullback, the market will again decline to the lower green wall. If the support level of 33666 breaks, the decline will continue to the lower yellow line and the support level of 33204.
Alternatively, growth is expected in the direction of the upper yellow line and the resistance level of 34722. If the bulls are strong enough and breakthrough this level, then a path will open for them to the upper green line and the resistance level of 35908.