
Ethereum may fall below $2,400 or surge to $3,000 anytime. Make sure you are ready for big price swings. Read our technical analysis and choose your trading strategy.
In the second part of this post, we’ll take a closer look at BMW. The automaker is an intriguing opinion this week as German stocks hit all-time highs on Tuesday.
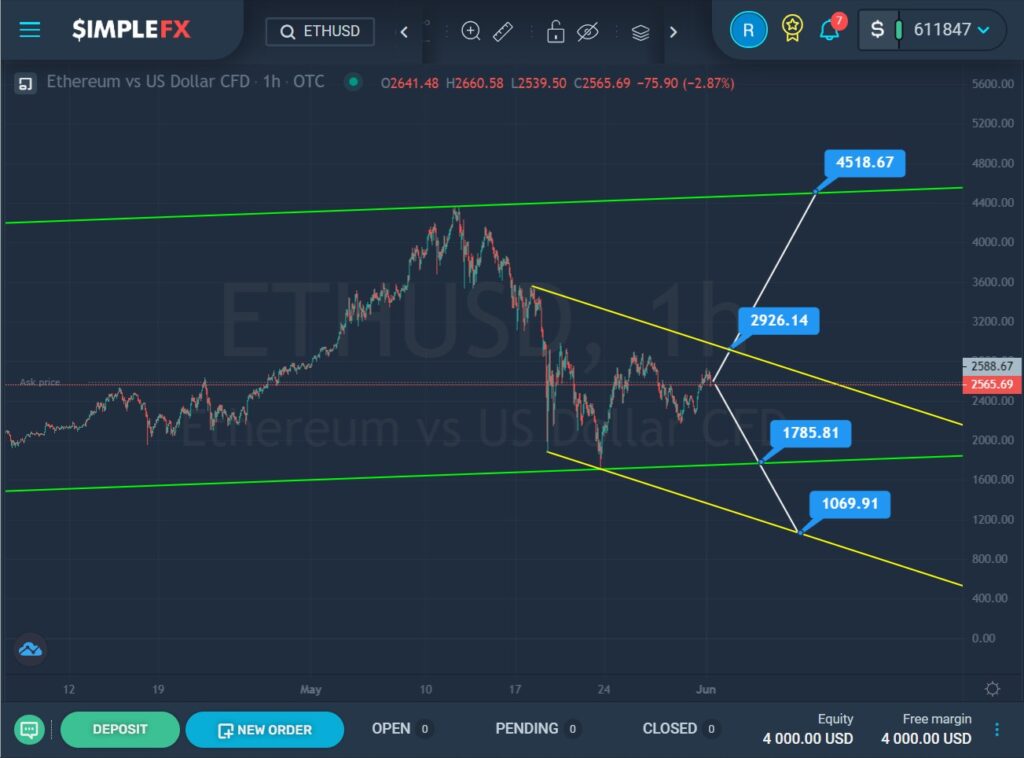
For the ETHUSD cryptocurrency pair, we see the formation of a global uptrend that moves within a large green channel.
Not so long ago, the price touched the upper green line, up to this point, the market was slowly rising up. After the lights out, we saw a rapid drop to the lower green wall. This section describes a yellow descending channel.
Currently, the market is near the upper yellow line. If the bulls push a little and can break through the resistance level of 2926.14, which is on this line, then nothing will prevent them from moving in an upward direction to the resistance level of 4518.67 and the upper green wall.
Alternatively, it is assumed that the price will go down again. Bears may again attempt to break through the lower green line near the support level of 1785.81. If this level is broken, the decline may continue to the support level of 1069.91, which is on the lower yellow line.
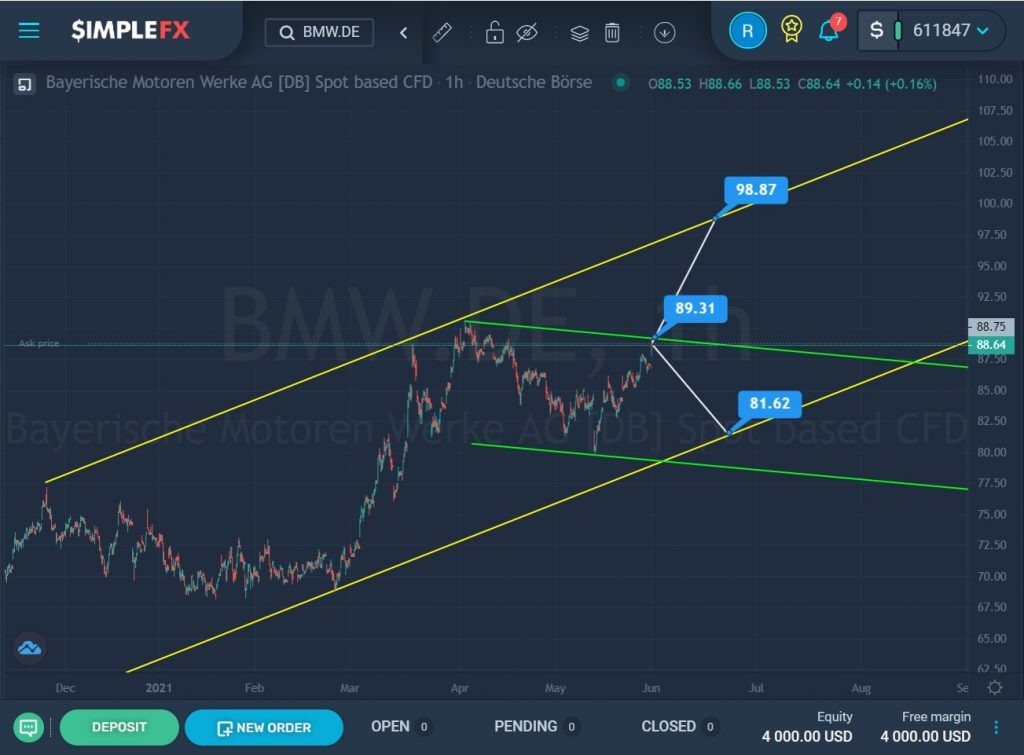
Let’s look at the situation on the shares BMW.DE. We see the formation of an uptrend that moves inside a large yellow channel.
After the last rebound from the upper yellow line, we saw a downward movement of the market inside a small green channel.
Currently, we see that the price is close to the resistance level of 89.31, which means that the bulls may be able to break through this price level. In this case, market participants can observe a continuation of the growth of stock prices to the next level of 98.87, which is on the upper yellow line.
If the bulls do not have enough strength to break through the level of 89.31, then the price can again push off from the upper green line and start moving in the direction of the lower green wall and the support level of 81.62.