
Cryptocurrencies have lost a strong trend recently. While BTCUSD goes up and down between $35,000 and $40,000, it’s even more difficult for altcoins. Today we try to grasp where the open-source smart contracts platform price could possibly head over the weekend.
In the second part of Friday’s analysis, you’ll find out some insights on how to trade UKOIL.
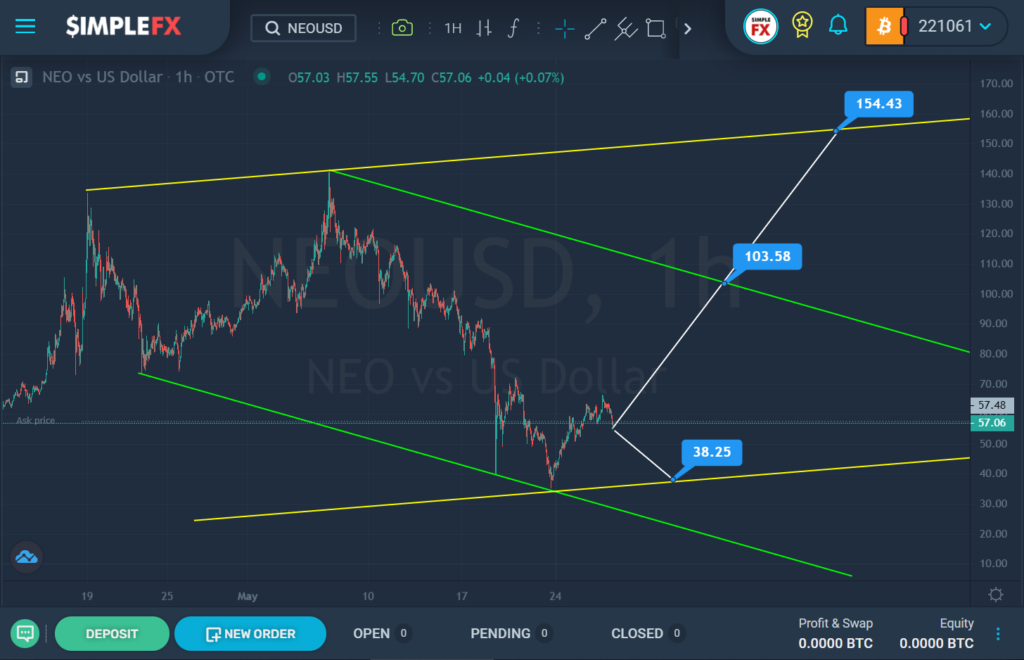
The NEOUSD pair seems to be forming a large uptrend that moves inside the yellow channel.
In the second half of April, the price pushed off from the upper yellow wall and went down, then we saw a second touch of the yellow line. However, the bulls failed to break through the resistance line, they lost their positions, and we saw a rapid decline within the descending green channel.
Just a few days ago, the price reached the lower yellow line, but then began to rise again. Perhaps the bullish move will continue. Most likely, the bulls are targeting the resistance level of 103.58, which is on the upper green line. If this level is successfully broken, the price may continue to rise to the next important level of 154.43.
Alternatively, a second decline to the lower yellow line and the support level of 38.25 is expected.
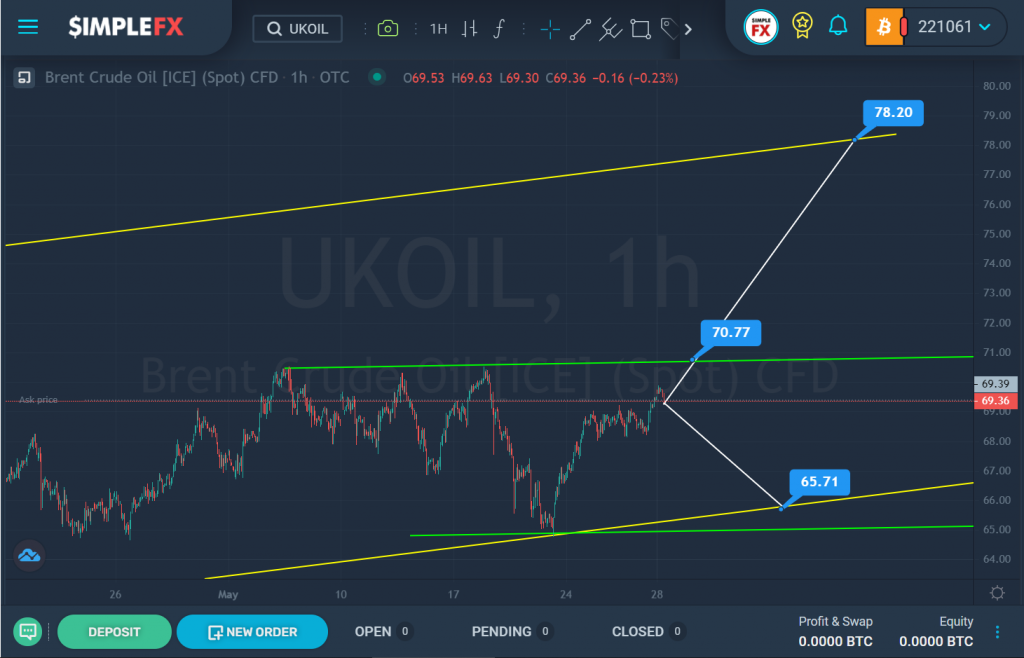
Most likely, a global uptrend is forming for UKOIL, which moves inside a large yellow channel. We can see that the price has been in the lower yellow area for a long time. A smaller green channel may show more accurate market behavior.
Currently, the price is near the upper green line. If the bulls bring the market to the resistance level of 70.77, and then break through this level, then we could see a continuation of the price increase to the resistance level of 78.20. This level is on the upper yellow line.
But the scenario may repeat, and the price will not go beyond the middle of the yellow channel. In this case, we could see the market decline in the direction of the lower yellow line and the support level of 65.71, which is located on it.