
For forex traders, this week we analyze USDCHF and EURJPY. Both pairs show potential for profitable moves. Take a look at the possible scenarios and make the best moves!
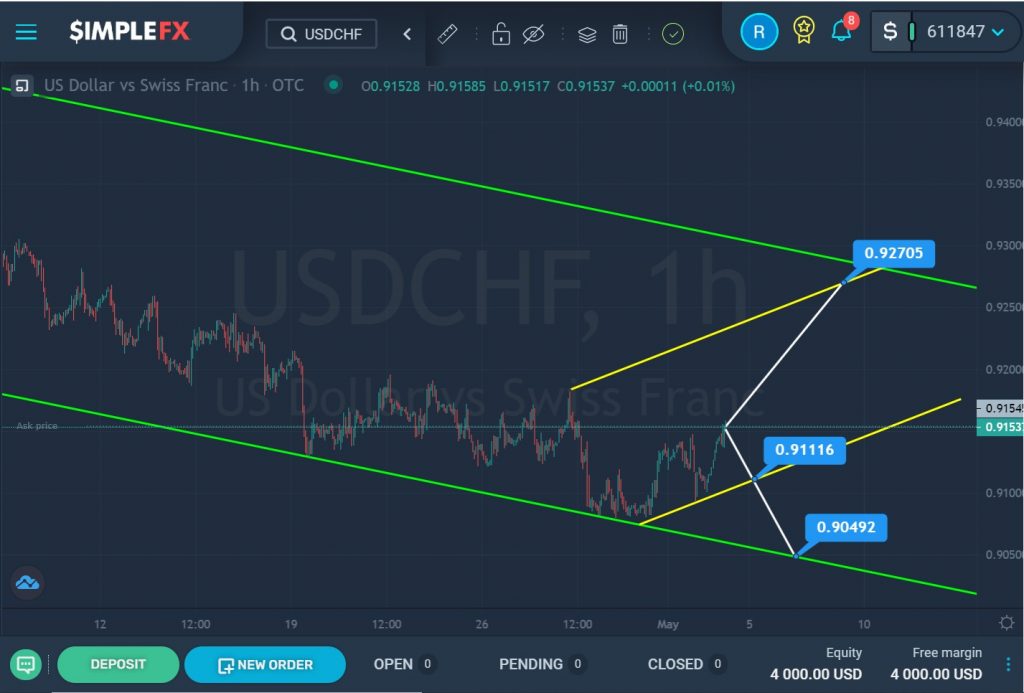
The current formation of the USDCHF currency pair shows a downtrend that moves within a large green channel.
We can see that the price has been in the lower green zone for the last month. It reached the bottom green wall, then pushed off from it. However, it did not rise high.
A few days ago, the market again pushed off from the lower green wall and began to move in an upward direction. Perhaps, during this month, the bulls have accumulated strength and are ready to lead the market. Thus, we can expect a bullish growth inside a small yellow channel to the upper yellow line and the resistance level of 0.927.
It is possible that the pair will repeat the previous scenario and go down again. This is possible when the support level of 0.911 is broken, which is on the lower yellow line. In this case, we could see a continuation of the pair’s depreciation towards the lower green line and the support level of 0.904.
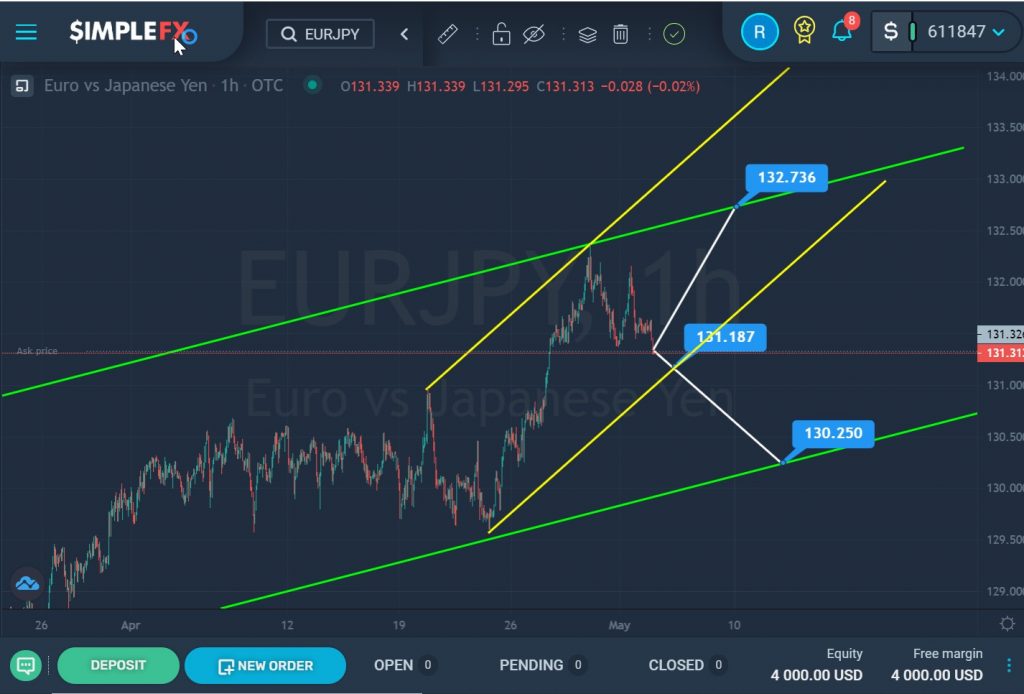
For the EURJPY currency pair, we see the construction of an uptrend, which is formed inside the green channel.
The last section of the chart, where we see a rebound from the lower green line and a sharp jump in the price to the upper green line, describes the yellow channel.
Recently, the price pushed off from the intersection of the two upper walls of these channels, and began to decline. It is possible that the decline will continue in the near future. If the support level of 131.18, which is located on the lower yellow line, breaks, the price may fall even lower – to the support level of 130.25, which is on the lower green line.
In the alternative, the price is expected to reverse and continue to rise in the direction of the upper green line and the resistance level of 132.73.