
Nasdaq has slowed down and is lagging behind S&P 500. Take a look at our analysis before trading today.
In the second part, we discuss what may happen to EURGBP in the near future.
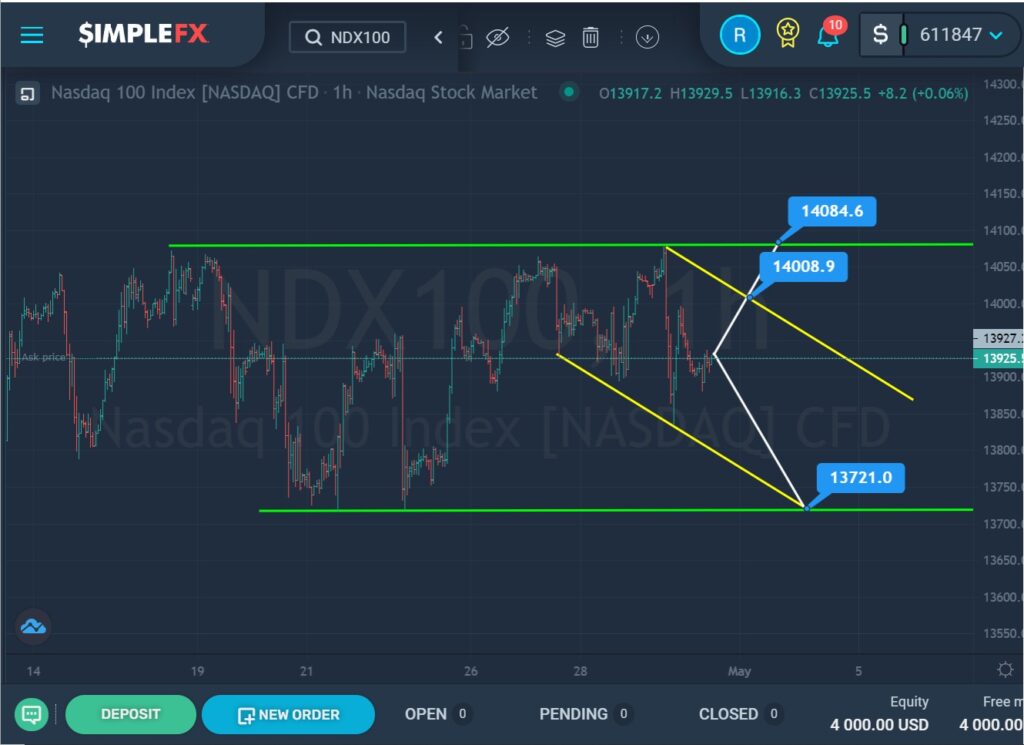
On the 1H timeframe of the NDX100 stock index, we see the formation of a horizontal trend that moves inside a large green channel.
After the last rebound from the lower green line, the price moved in an upward direction in jumps. Not so long ago, the market touched the upper green line.
It is assumed that the bulls have no strength left to continue moving the price up, so we could see the price decline inside the small yellow channel to the support level of 13721.0. That level is at the intersection of the two lower walls of the yellow and green channels.
However, if the bulls are still able to lead the market, then if the resistance level is broken, which is on the upper yellow line, the bulls can continue to move up to the level of 14084.6, located on the upper line of the green channel.
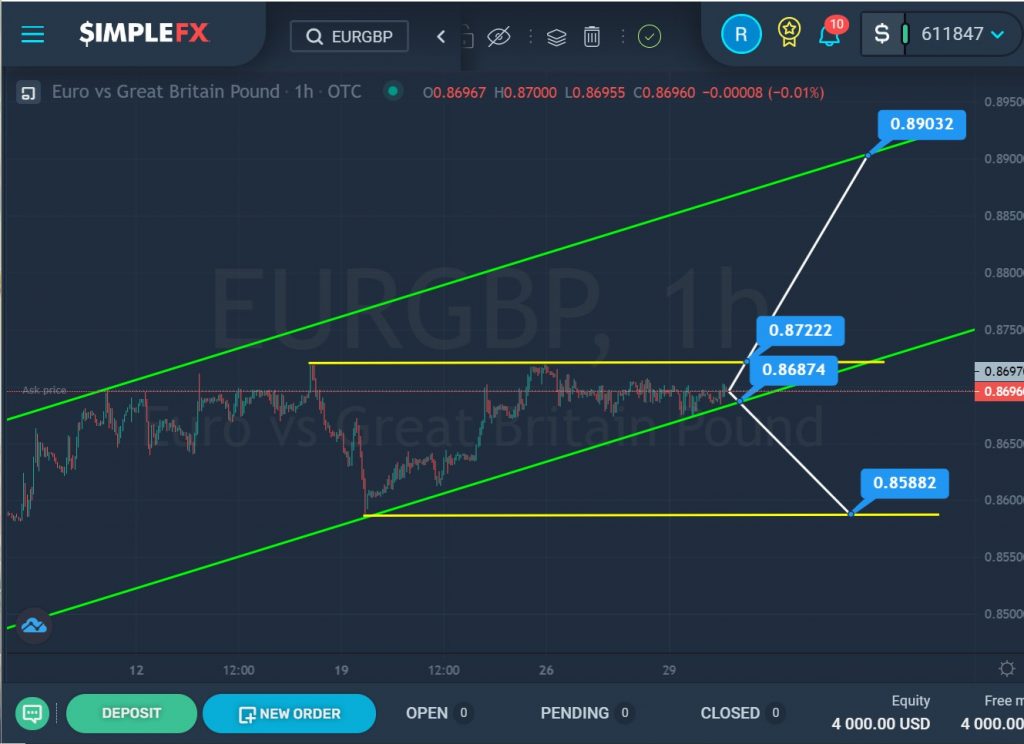
For the EURGBP currency pair, we see the continuation of the bullish trend, which moves within the green channel.
In the last section of the chart, we can see that the price touched the lower green wall and then went up. But when it reached the middle of the channel, it turned around and started moving again towards the lower green line. This section describes a small yellow channel.
At the moment, we are near the upper line of the yellow channel and the lower line of the green channel. If the market continues to go down and breaks the support level of 0.868, then we can see the pair devaluing to the support level of 0.858, which is on the lower line of the yellow channel.
Alternatively, the price is expected to rise. If the resistance level of 0.872, which is on the upper yellow wall, is successfully broken, market participants will see the price rise to a higher resistance level of 0.890, which is on the upper green line.