

US equities slowed down a little bit, but it seems we are still in the bull market. Recently S&P 500 gained benefiting from a weaker dollar. How long will it last? Let’s take a look at technical analysis.
We also take apart the recent XAUUSD plunge. Will gold recover or is it a sign of a downturn?
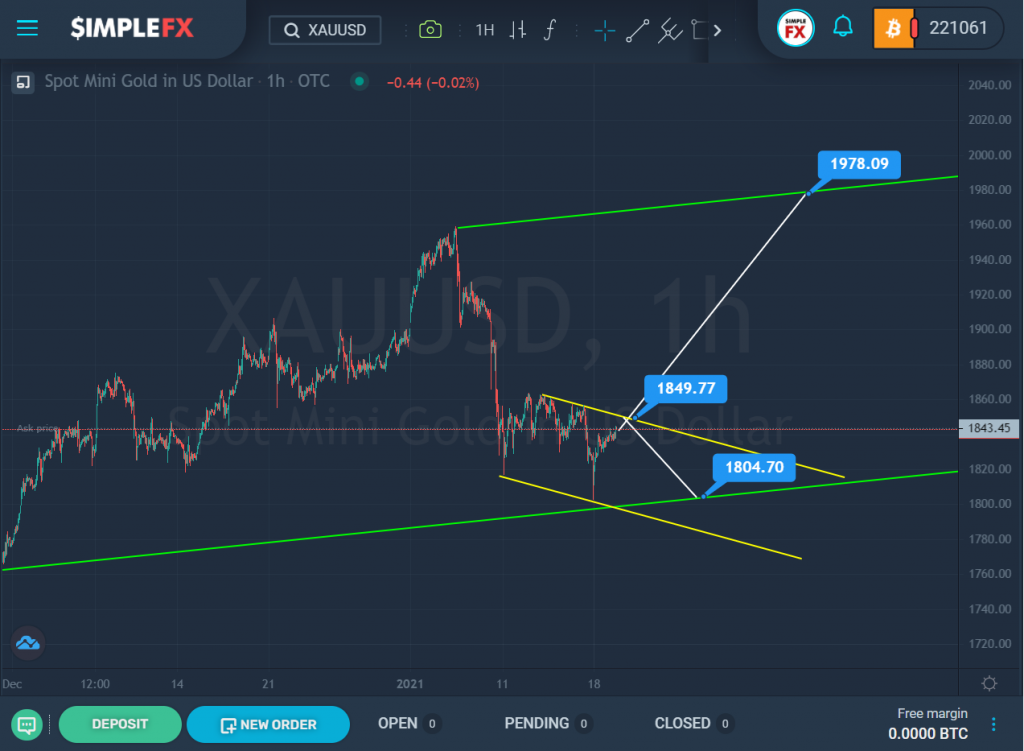
The XAUUSD formation hints at the construction of a bullish trend that moves within the ascending green channel.
After the last rebound from the upper green line, the price began to fall sharply down. The last section of the chart describes a small yellow channel.
Since the market is now near the upper yellow line, it is likely that the bulls will be able to reach the resistance level of 1849.77, and if this level breaks, they will have a clear path to the upper green wall and the resistance level of 1978.09.
If the bulls do not have enough strength to break through the upper yellow line, the price will continue to decline to the support level of 1804.70, which is on the lower line of the green channel.
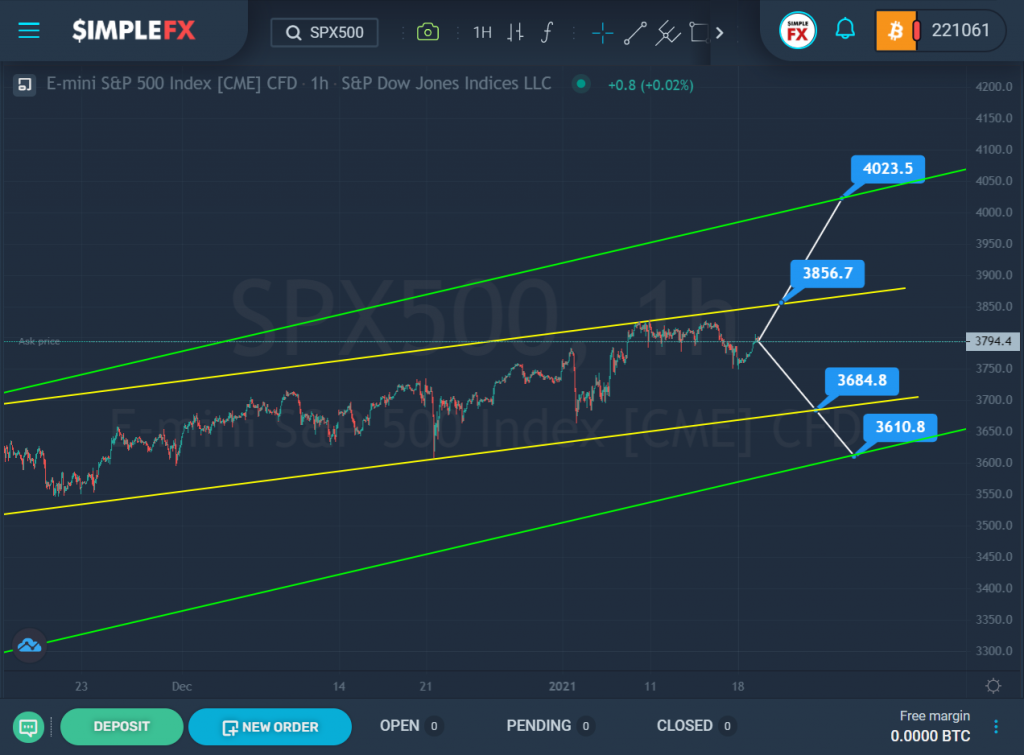
The current structure of the SPX500 index shows the formation of an uptrend that moves within the green and yellow channels.
The yellow channel describes the situation in more detail. In the last section of the chart, we see that the price was in the upper zone of this channel for some time, but could not break through it and began to decline.
It is possible that in the next coming trading days we will see a decline in the market to the lower yellow line and the support level of 3684.8, and if this level is broken, the decline in the index may continue to a lower support level, which is on the lower line of the green channel.
We should not rule out the option in which the bulls will again try to break through the yellow line. They will succeed if they can break through the resistance level of 3856.7, which is on it. In this case, the price growth will continue to the upper green wall and the resistance level of 4023.5.