

After the Brexit finally happened pound sterling still is one of the most exciting currencies to trade on forex markets. Take a look at our analysis of GBPUSD and see how it compares to EURUSD.
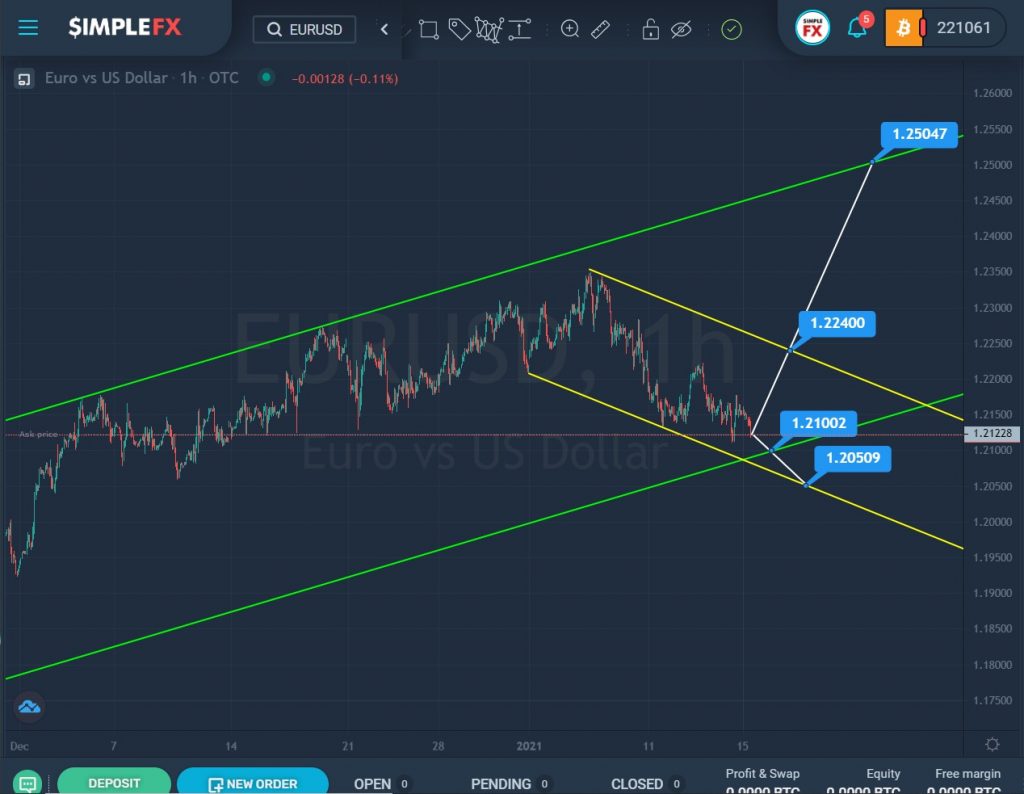
We talked about the EURUSD currency pair in the first half of December 2020. The market still continues to build a bullish trend, which moves within a large green channel.
After the last rebound of the price from the upper green line, the bears began to slowly crawl down.
The last section of the chart describes a small yellow channel. Now the price is in the lower green zone, perhaps the bears will bring the market to the green wall, and in the event of a break of the support level of 1.210, which is on it, the price may fall to the support level of 1.205, which is on the lower yellow wall.
Alternatively, we could see an upward movement of the market towards the upper yellow line. If the resistance level of 1.224 breaks, the bulls will open the way to the green line and the next important resistance level of 1.250.
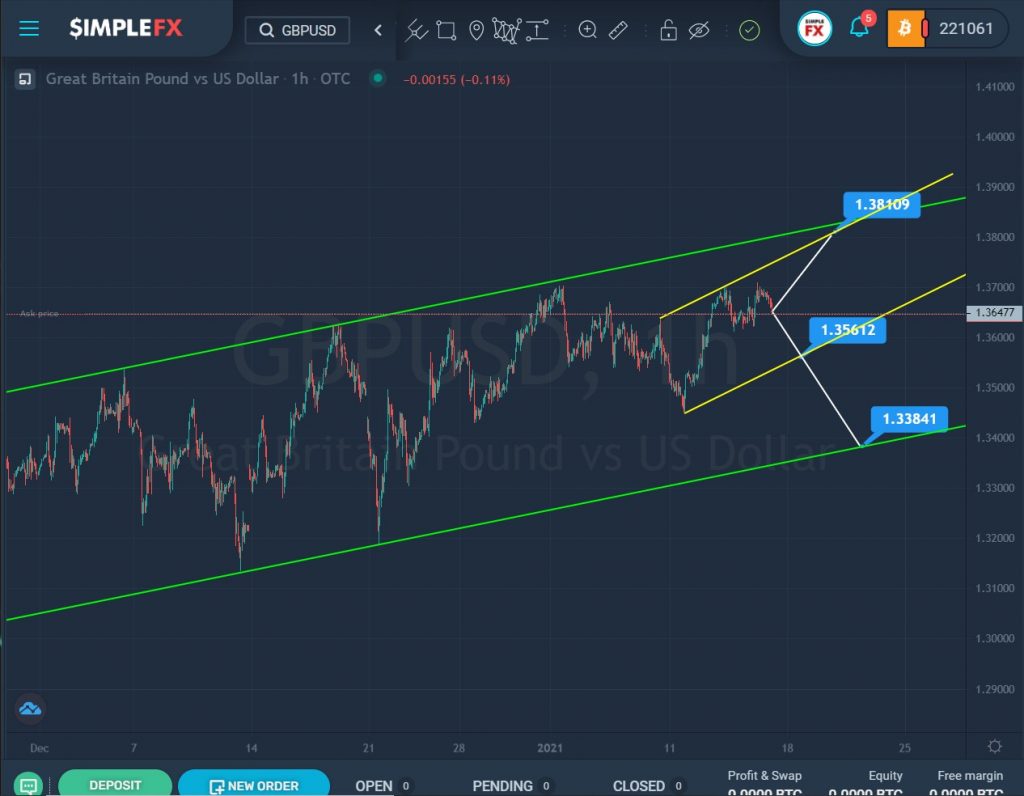
The formation of the GBPUSD currency pair shows a bullish trend that moves within the green channel.
In December 2020, the market moved dynamically up and down from the lower green wall to the upper green wall. Not so long ago, the price pushed off from the upper green line. The last section of the chart describes a small yellow channel.
Since the price, having reached the middle of the green channel, turned around and began to grow, it is likely that the increase will continue further, and the bulls will be able to reach the resistance level of 1.381, which is located on the upper yellow wall.
The alternative option assumes the weakness of the bulls, so market participants can expect the price to fall to the lower yellow line and the support level of 1.356. If that level is broken, the bears will open the way to the next support level of 1.338, which is on the lower line of the green channel.