

XAUUSD fails to break through the resistance and is in danger of falling to a downtrend channel. At the same time, the US stock market seemed to enter a strong uptrend a few days ago. Take a look at our chart analysis for this week.
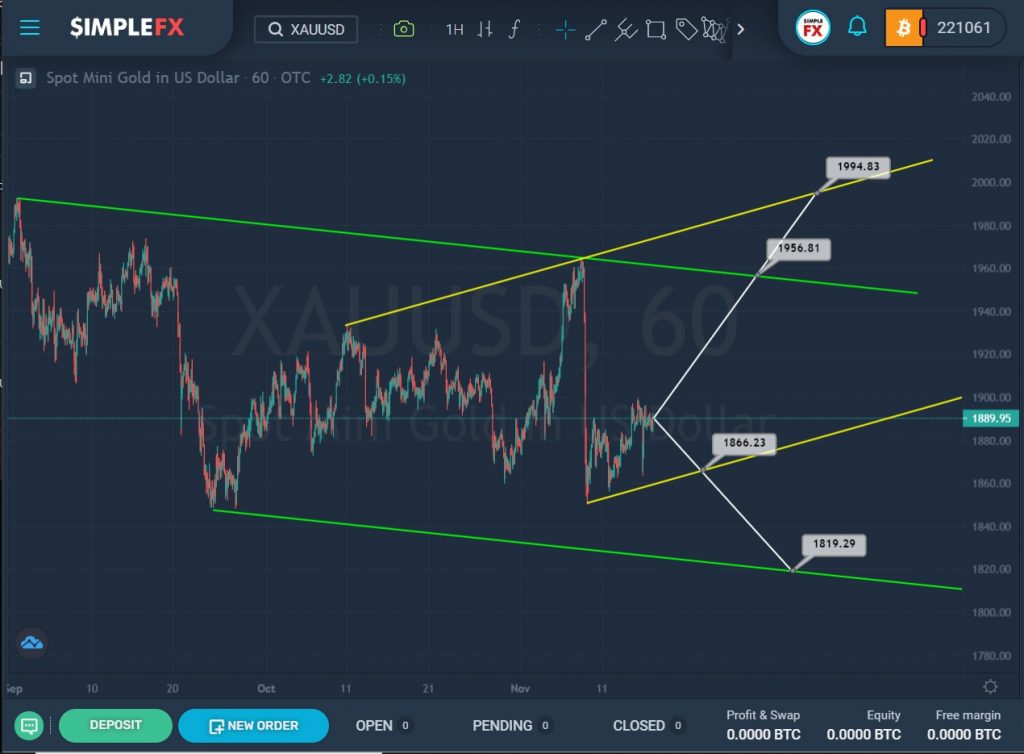
The XAUUSD structure hints at the construction of a downtrend that moves inside the green channel.
Not so long ago, after the last rebound of the price from the lower green line, we saw an upward movement of the market within the yellow channel.
In the last section of the chart, we see how the price fell sharply from the intersection of the upper lines of these two channels to the lower yellow wall.
Currently, the market is moving up again. Most likely, the growth will continue to the resistance level of 1956.81, which is on the upper yellow line, and in the event of a break of this level, we could see the growth even higher to the next important level of 1994.83, which is on the upper wall of the yellow channel.
It is possible that the bears have not lost their strength yet, so it is possible that they will again lead the market in a downward direction. If the bears manage to reach the support level of 1866.23, located on the lower yellow line, and then break through it, then gold may devalue to the level of 1819.29, located on the support line of the green channel.
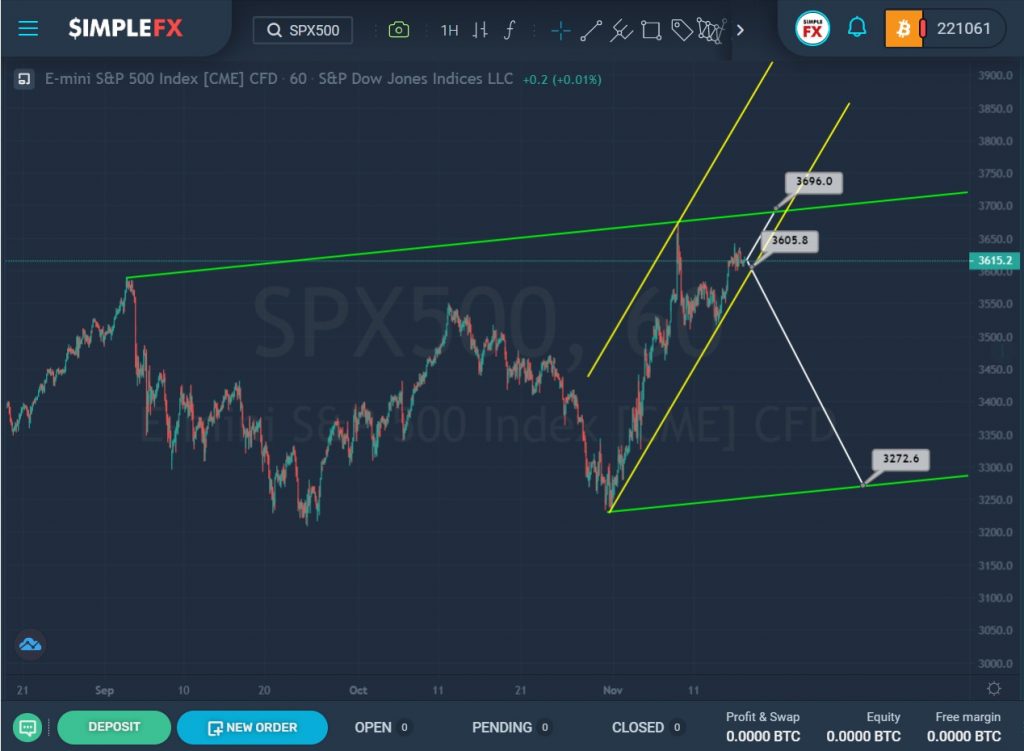
The structure of the SPX500 index shows an uptrend that is forming inside the green channel.
Not so long ago, we saw the price rebound from the lower green line, after which the market began to grow rapidly. This small uptrend describes the yellow channel.
We see that the price reached the upper green line, but did not break it. Most likely, the bulls will once again try to push the market up.
If the price does not break the lower yellow wall, we can see the price rise to the upper green line and the resistance level of 3696.0.
However, if the price touches the lower yellow wall and breaks the support level of 3605.8, then the market will open the way to the lower wall of the green channel and the support level of 3272.6.
It is preferable to add this pair to our watchlist!