
The eurozone preliminary GDP is released today. How did European economies react to the pandemic in the third quarter? Take a look at our EURUSD technical analysis and make the right call on the changing market.
Today we also take a look at pound sterling as GBPUSD should also be affected.
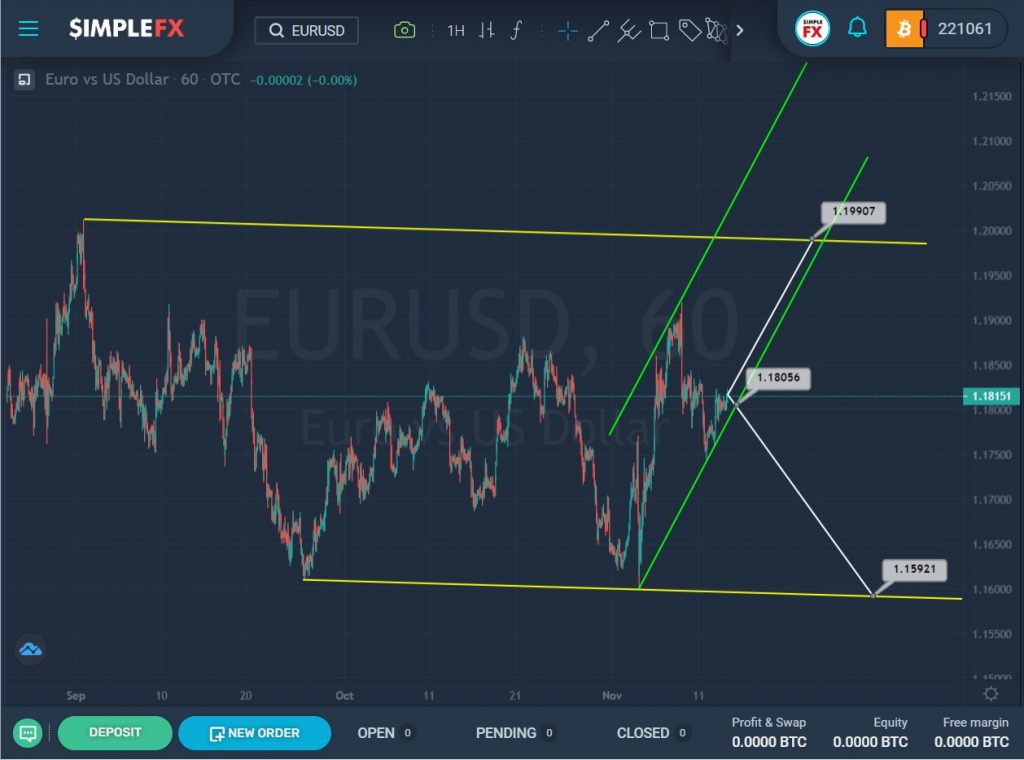
The EURUSD structure shows a flat that moves inside a large yellow channel.
For some time, the market pushed off from the lower line, rose to the middle of the channel, or slightly higher, and again fell to the support line.
Recently, the price pushed off from the lower wall of the yellow channel and the market began to move rapidly upwards. This section of the chart describes a small green channel.
Currently, the currency pair is in the lower green line zone, and if the market reaches the support level of 1.180 and then breaks it, then we can see a repetition of the previous price action, that is, the market may fall to the lower yellow line and to the support level of 1.159.
However, there is a possibility that the bulls will be strong enough to continue driving the market up. If the price continues to move inside the green channel and does not break through its lower wall, then we could see the rise of the currency pair to the upper yellow line and the resistance level of 1.199.
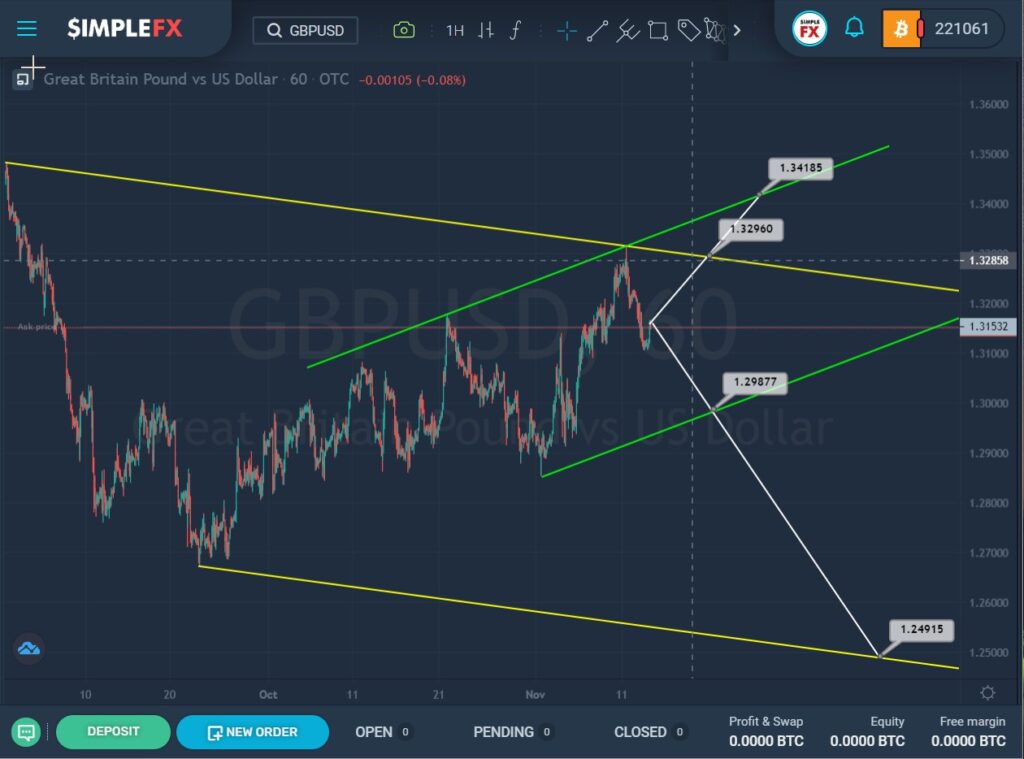
The GBPUSD currency pair shows a downtrend that moves inside the yellow channel.
After the last rebound from the lower yellow wall, we see a smooth increase in the price, the behavior of which is described by the ascending green channel.
The market recently touched the upper wall of the yellow channel but did not break it. It is possible that after a slight correction, the bulls will again lead the market in an upward direction to the resistance level of 1.329, which is at the yellow line. In case of a successful break of the indicated level, the bullish trend may continue its growth to the next important level of 1.341, which is on the upper wall of the green channel.
Alternatively, the price is expected to continue falling. If the market reaches the support level of 1.298, which is at the lower green line, and breaks it, then it will have a free path to the lower yellow line and support level of 1.249.