
The US stock markets go up as investors seem not to worry about the results of the presidential elections, which haven’t been concluded yet. We take a closer look a the Dow Jones. Although DJI30 moved up this week, we can see a mild downturn on a broader scale.
As for the forex pairs, we’ll show you our analysis of the GBPAUD pair.
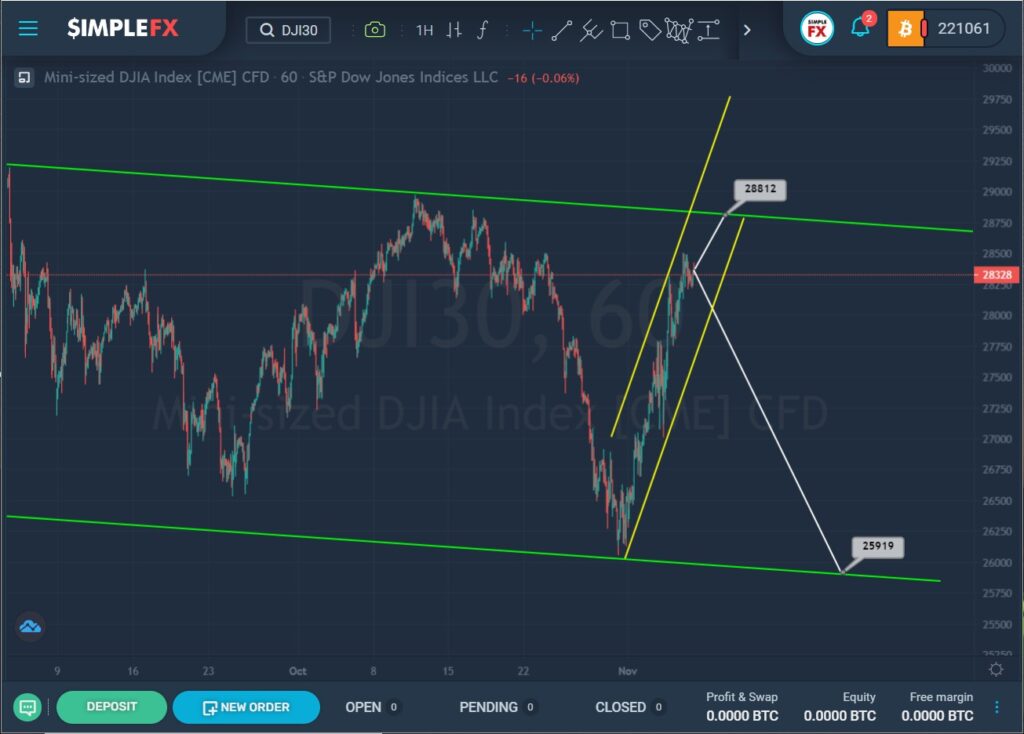
The current DJI30 formation shows a downtrend that is moving inside a large green channel.
In the previous month, we saw the market push off from the upper green wall and reach the lower line of the green channel, then start to grow again.
The last section of the price move describes a small yellow channel.
If the market fails to break through the lower yellow line, the growth may continue to the upper green wall and the resistance level of 28812, moving inside the yellow channel.
However, if the market starts to decline, and the bears can break through the support level, which is on the lower yellow wall, then the decline may continue to the lower support level of 25919, located on the lower line of the green channel.
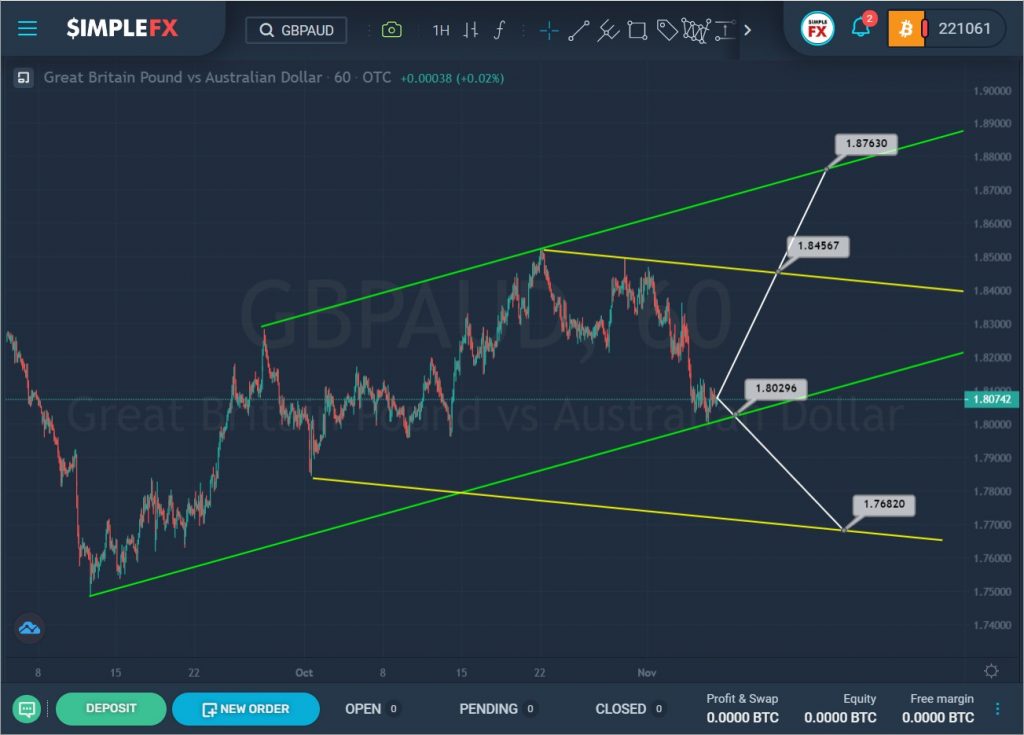
The GBPAUD currency pair moves inside the ascending green and descending yellow channels.
At the time of writing, the market is in the center of the yellow channel and in the lower zone of the green channel.
In this situation, we can observe two scenarios. In the first case, we could see the price decline to the support level of 1.802, which is on the lower green wall, then, if this level is successfully broken, the price may fall even lower to the next support level, which is on the lower yellow line.
In the second option, we can observe the development of an uptrend, the first goal of which is the resistance level of 1.845, located on the upper line of the yellow channel. With a successful break of that level, the growth is expected to continue to the upper green wall and the resistance level of 1.876.