
Take a look at our USDTRY analysis as the Turkish lira becomes the hottest forex trading asset.
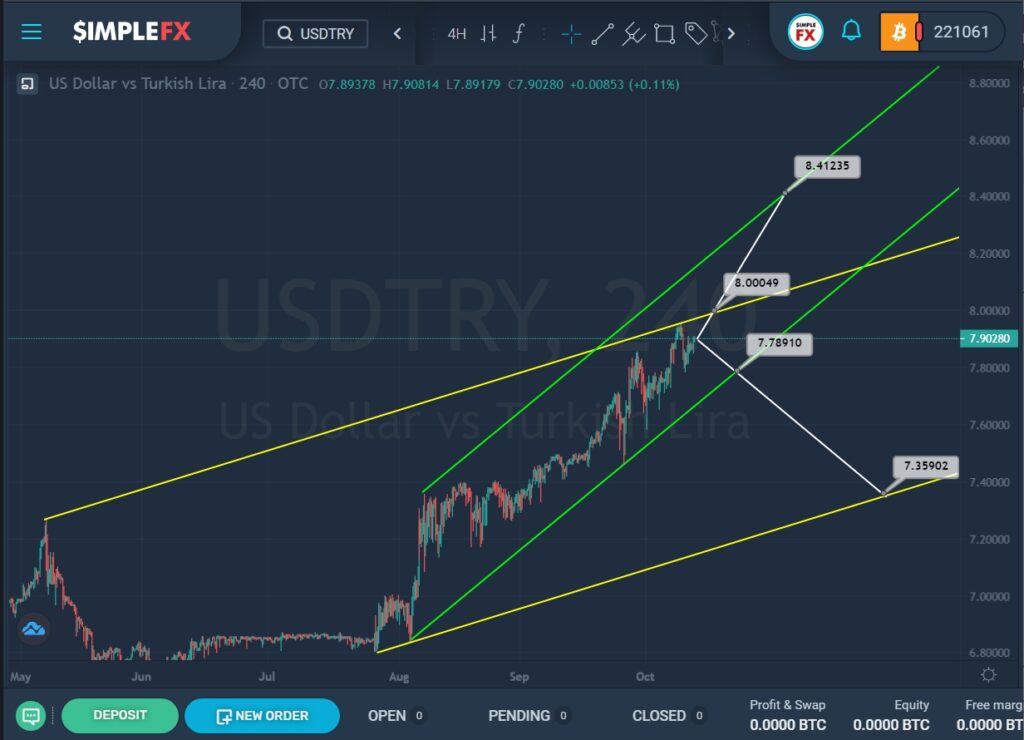
The USDTRY structure hints at the construction of an uptrend, which is formed within the yellow channel.
A small green channel describes the latest upward trend, which we saw after the rebound from the lower yellow line.
At the time of writing, the price is in the upper zone of the yellow channel. When the support level reaches 8.00, and then when it breaks, we could see a continuation of price growth towards the upper green line and the support level of 8.41.
However, it is likely that the market will not go beyond the yellow channel, and in the near future, we will see a decline in the price.
If the bears can break through the nearest support level of 7.78, which is on the lower green wall, then we can expect the currency pair to continue to decline to the next important support level of 7.35, located on the lower line of the yellow channel.
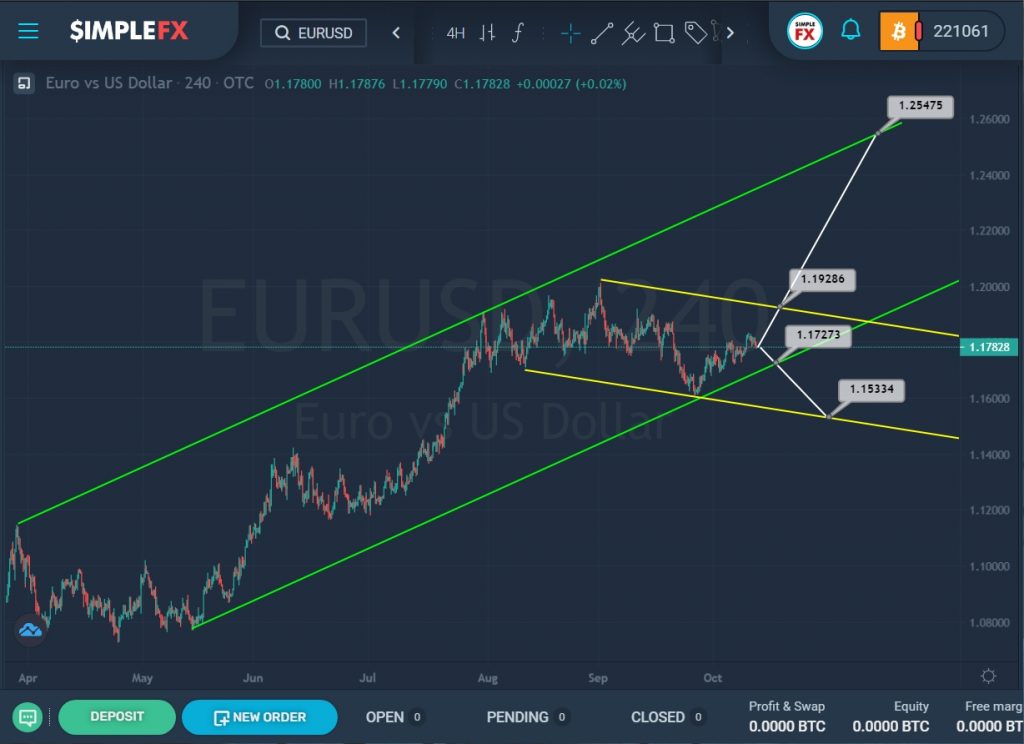
The current EURUSD structure shows an uptrend that moves inside the green channel.
In the last section of the chart, we see that after the rebound from the upper green wall, the market began to move smoothly down, and recently touched the lower green line, but the bears failed to break through it.
The price behavior on the specified section is described by a small yellow channel.
After the rebound from the lower lines of the green and yellow channels, the price increase began.
In the near term, the market may continue to increase towards the level of 1.192, which is on the upper yellow wall, and if the bulls can break through this level, then they will have a clear path to the next resistance level of 1.254, which is on the upper line of the green channel.
Alternatively, we consider the situation when bears continue to lead the market down. If in the near future they can reach the support level of 1.172, located on the lower green line, and breakthrough it, then the market will open the way to the lower line of the yellow channel and the support level of 1.153.