
Bitcoin breaks the $11,000 resistance, and it’s another great chance to trade the leading cryptocurrency. For Forex enthusiasts we recommend taking a close look at the pound sterling vs. Australian dollar pair.
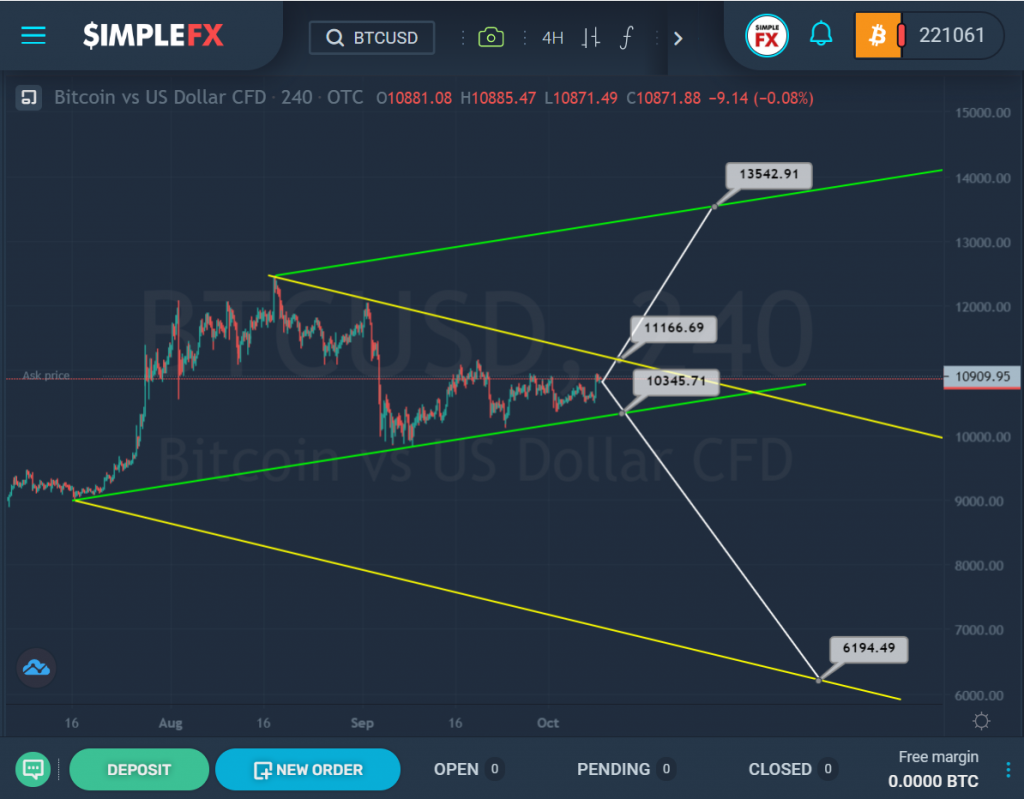
The BTCUSD cryptocurrency pair moves inside the ascending green and descending yellow channels.
Currently, the price is near the upper yellow wall and the lower green wall, and it was pretty obvious it would break the $11,000 limit soon.
If the market continues to move in an upward direction in the near future and can break through the resistance level of 11166.69, which is on the upper yellow line, then it will have a clear path to the upper green wall. In this case, the price may rise to the resistance level of 13542.91, located on the green line.
However, there is a possibility that the downtrend will continue to develop. Thus, in the near future, we can observe a price decline to the lower green line, and if the bears can break through the support level of 10345.71, which is on it, then the decline can be continued even lower, that is, to the yellow line and the next support level of 6194.49.
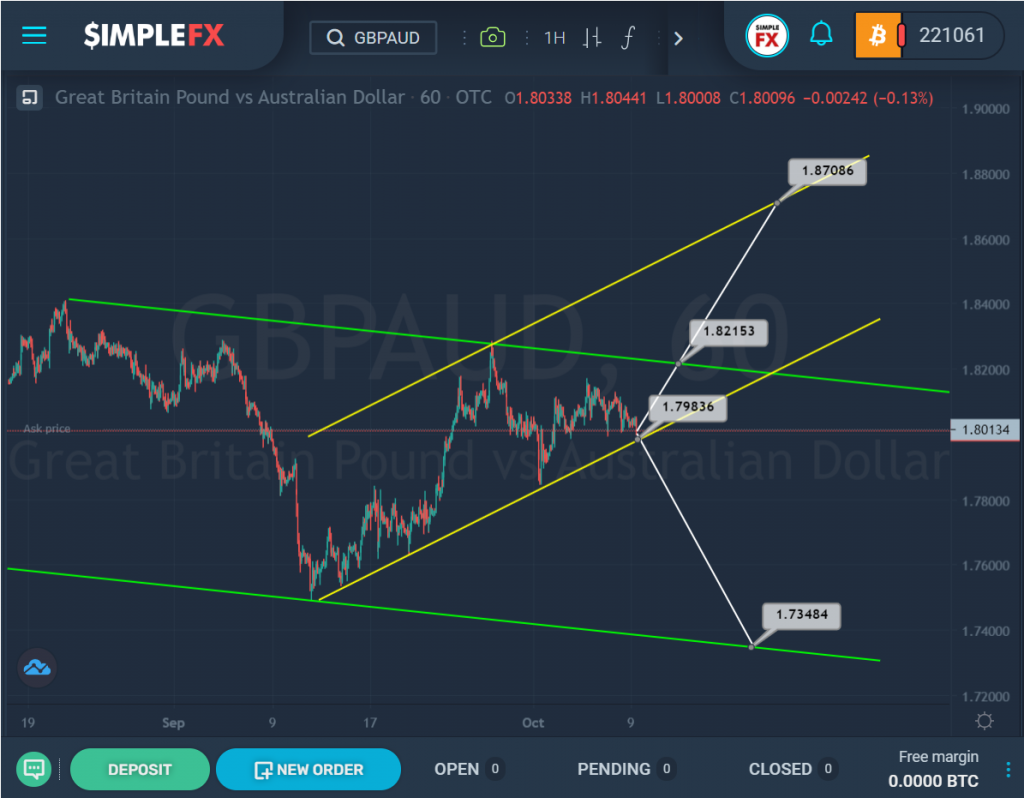
The current GBPAUD structure shows the formation of a bearish trend that moves inside the green channel.
In September 2020, we saw the price rebound from the lower green line, after which the market began to grow and the price reached the upper green line but did not break it. This entire path is described by the yellow channel.
If the bulls continue to push the market up, it will soon again approach the upper green wall. If the resistance level of 1.821 breaks, which is on the green line, we could expect the currency pair to rise to the next important level of 1.870, which is on the upper yellow line.
Since the price has now almost reached the support level of 1.798, which is on the lower green line, it is likely that the bears are stronger than the bulls, which means that they may be able to break through this level and send the pair even lower. That is, in this case, we could see the price fall to the lower green wall and the support level of 1.734.