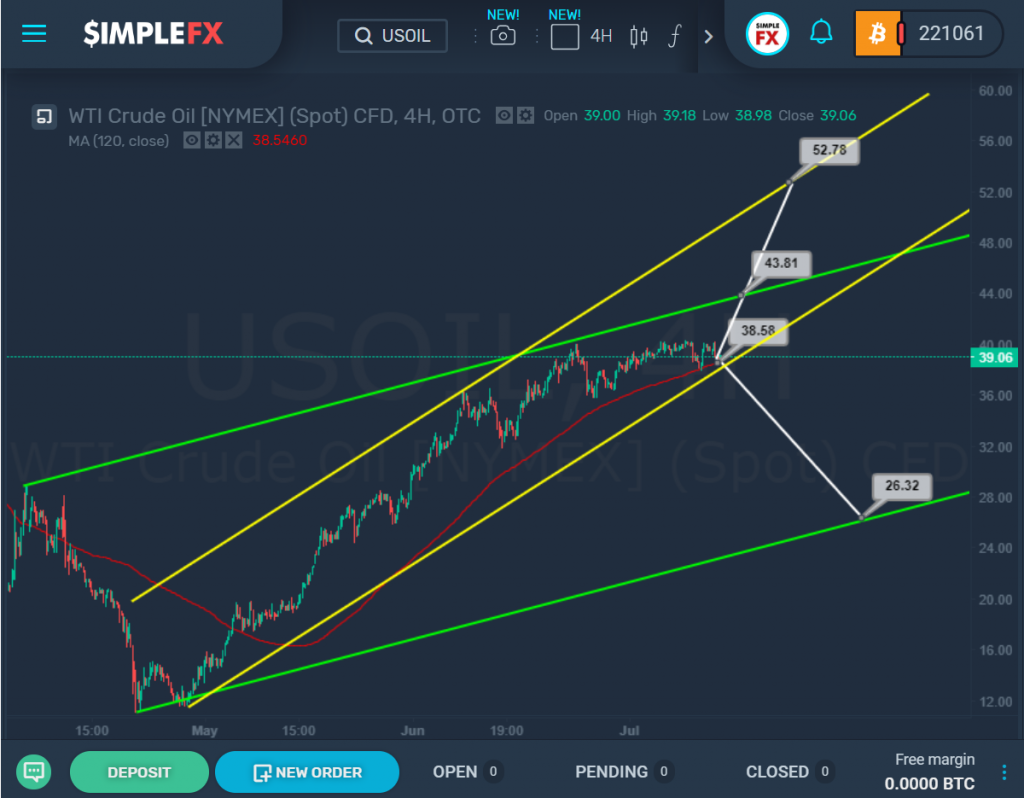
The current USOIL structure suggests that the market is moving within the green and yellow ascending channels. After rebounding from the upper line of the green channel, the price moved in a flat to the lower line of the yellow channel.
Now the market is right on the lower yellow wall, which is the support line for the price. If the level of 38.58 breaks down, the bears will open a path towards the lower line of the green channel and the support level of 26.32.
An alternative option indicates that the market may push off from the lower yellow line and start moving up to the resistance level of 43.81, which is on the green wall.
If this level is broken, the bulls will be able to grow to 52.78, i.e. to the upper line of the yellow channel. The approximate trajectory of a possible future movement is shown on the chart.
On USDJPY, the market moves inside two channels directed downward. The green channel describes the price behavior more precisely since it is smaller in size.
Not so long ago, the price pushed off from the lower green line and rose to the upper green wall. Then we saw a decline in the central zone of this channel. At the moment, it is not clear which line will be reached first, the support or resistance line.
If the bulls continue to move up and reach the level of 108.44, then when it is breaking up, the rise will continue up to the top yellow line and the resistance level of 109.47.
However, if we see a decline to the support of 103.86, and then a break of the lower green line down, then in the following trading weeks, a decline to the level of 98.47, which is on the lower yellow line, is possible.
It is preferable to add this pair on our watchlist!