


SimpleFX XAUUSD Chart Analysis: July 10, 2020
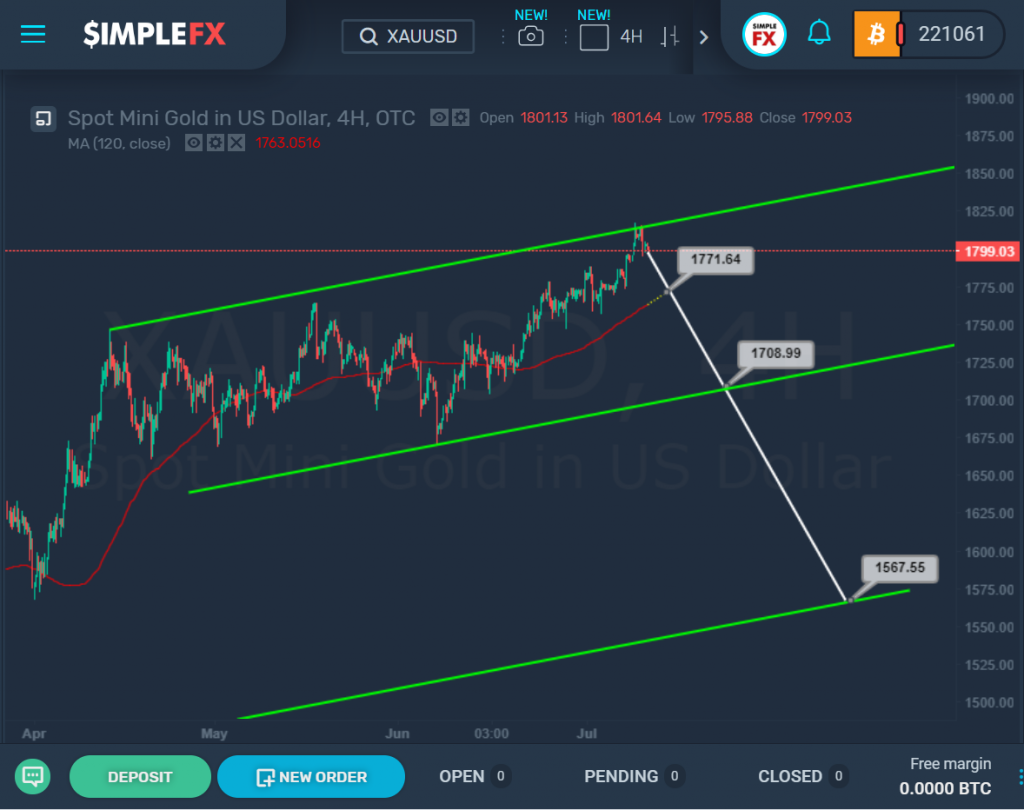
The current XAUUSD structure hints to the formation of a major uptrend that looks fully completed. If this is the case, then the upper green line is the resistance line for the price.
Therefore, in the near future, we could see the market decline to the support level of 1708.99. The way to this level will open for bears if the moving average breaks down near 1771.64.
Further, if the green support line and the 1708.99 level are broken down, the decline may continue to 1567.55, i.e. to the lower line of the green channel.
In this regard, in the near future, there is a high probability of a downward movement of the market.

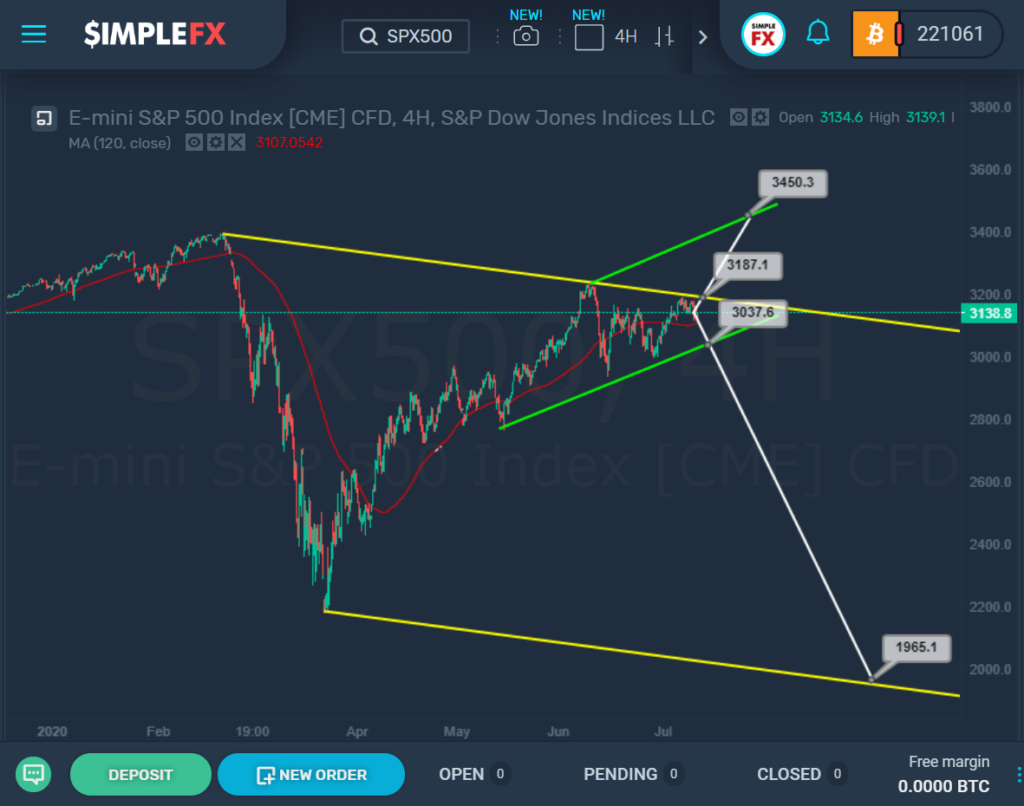
SPX500 suggests the formation of a large yellow channel, in which the price has repeatedly approached its upper yellow line.
It is likely that the rebound from the yellow line and the resistance level has already occurred, so we could soon see a decline to the lower wall of the small green channel and the support level of 3037.6.
Then, when this level breaks down, the price could open a path even lower to the lower line of the large yellow channel in the 1965.1 area.
However, there is a possibility of an alternative scenario that can be implemented if the market goes higher and breaks up the upper yellow line near 3187.1. In this case, the way to the upper green line and the resistance of 3450.3 will open for the bulls.
Both possible price movements are shown schematically on the chart.


