
SimpleFX EURUSD Chart Analysis: July 8, 2020
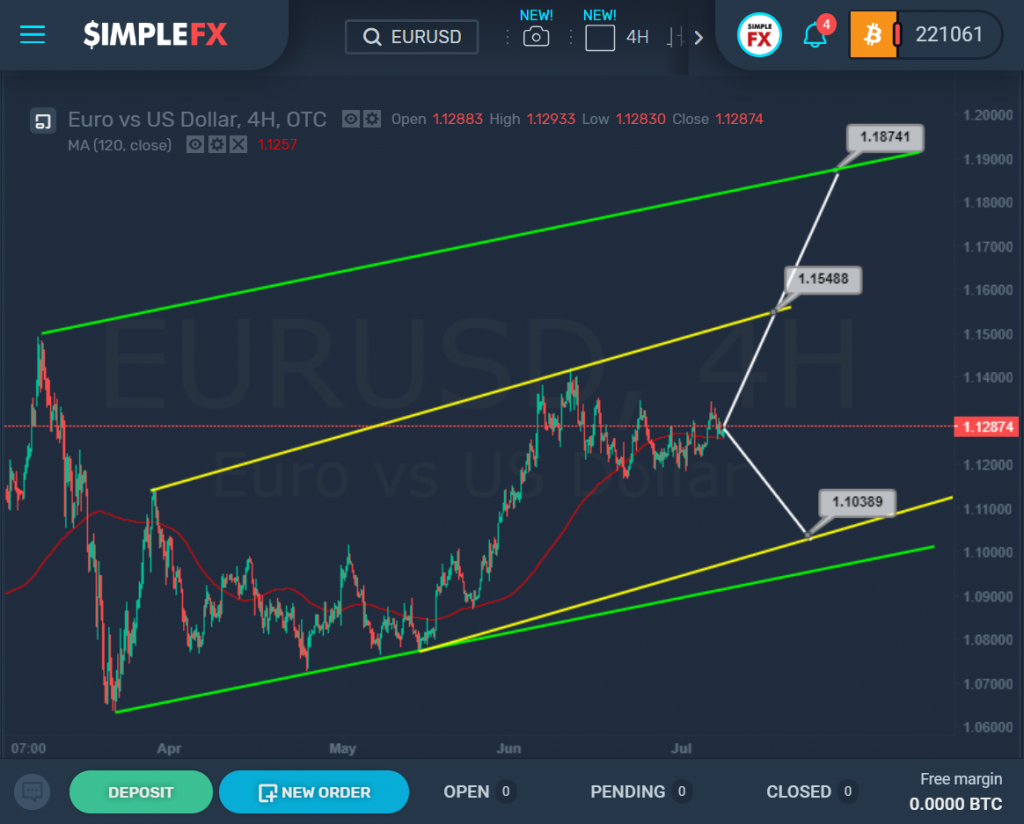
The current EURUSD structure suggests that the market is forming a small bullish trend that moves inside the yellow and green channels.
At the moment, we are seeing a flat in the upper zone of the yellow channel. Usually, a flat is a trend continuation pattern, i.e. after the flat ends, the market moves in the same direction as it did before the flat was formed.
Thus, it is highly likely that after the completion of this sideways move, we can see the market grow in the direction of the upper line of the yellow channel and the resistance level of 1.154. Then, when this level is broken, the price will open a path to the upper green line and the next resistance level of 1.187.
An alternative scenario can be implemented in the case of a downward movement to the lower yellow line, which is the support line for the price. In the case of a downtrend, bears are expected to decline to the 1.103 area.
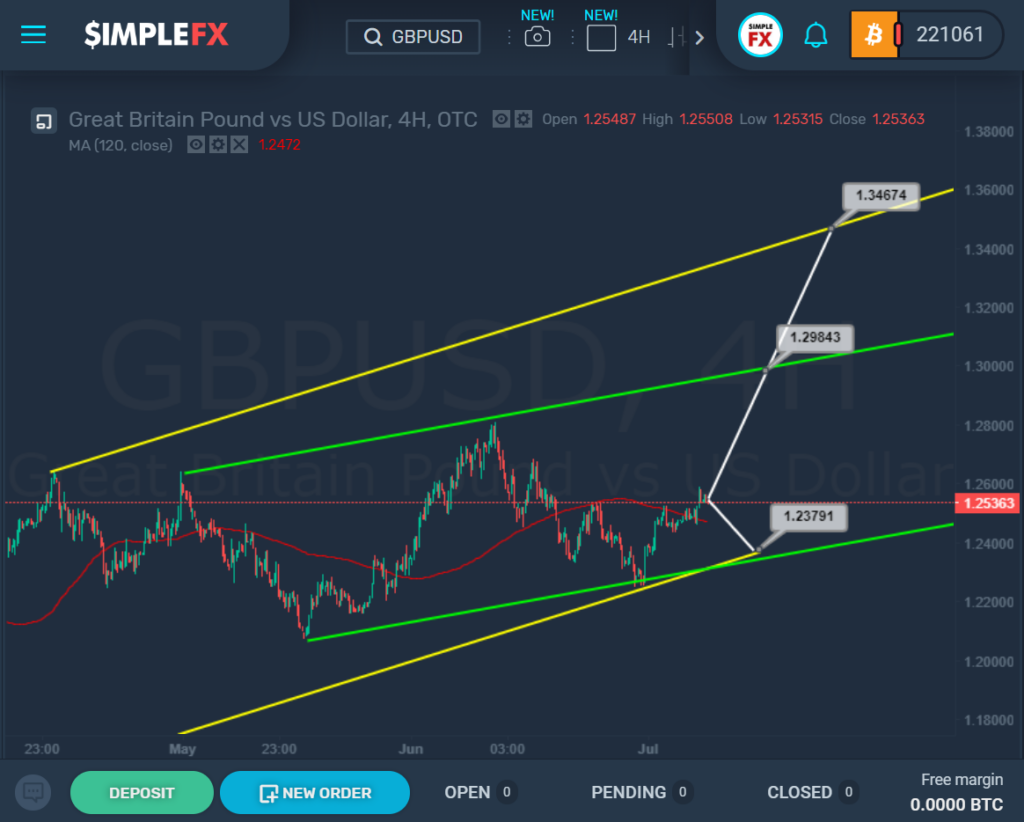
For quite a long time, we have seen the market move inside the yellow channel. The green channel describes price behavior more precisely.
Not so long ago, the market pushed off from the lower lines of the green and yellow channels, after which we saw the price rise to the central zone of the green channel.
If this trend continues, then during the next trading weeks we will see the currency pair rise to the resistance level of 1.298, which is on the upper wall of the green channel. Then, when this level is broken, the bulls will open a path to the upper yellow line and the resistance level of 1.346.
The situation will unfold according to an alternative scenario in the case of a repeated decline in the area of the lower line of the yellow channel. The target in this case is at the level of 1.237.