
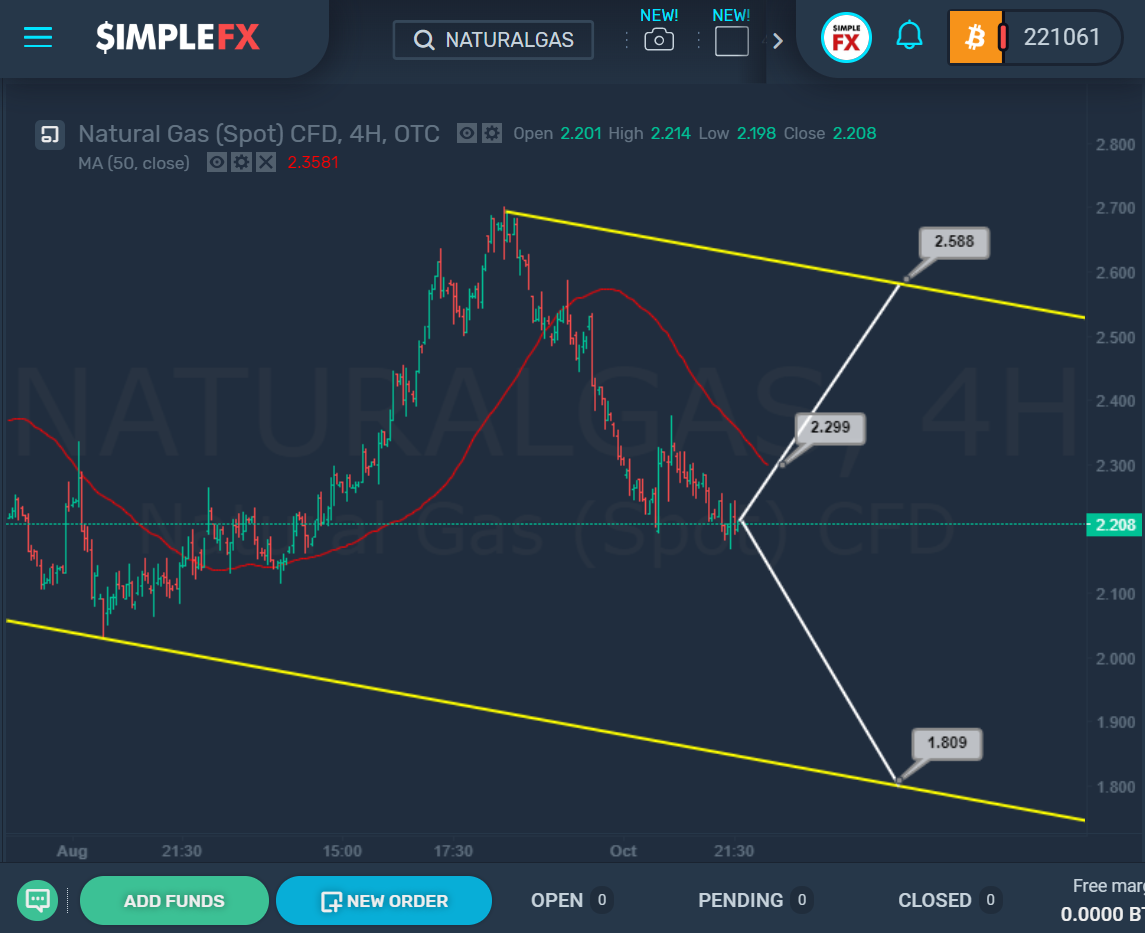
 The market continues to move within the large descending yellow channel. Most likely, now we see a downward movement from the upper bound of this channel to its lower wall. Given that the price is well below the moving average, bears may have a great potential to decline. Thus, in the near future, we may see a downtrend in the direction of the lower bound of the yellow channel to the level of 1.809. However, if the moving average breaks up around the level of 2.299, the price may open a path to the resistance level of 2.588, which is located on the upper yellow bound. We should bear in mind that this scenario is an alternative one.The market continues to move within the large descending yellow channel. Most likely, now we see a downward movement from the upper bound of this channel to its lower wall. Given that the price is well below the moving average, bears may have a great potential to decline. Thus, in the near future, we may see a downtrend in the direction of the lower bound of the yellow channel to the level of 1.809. However, if the moving average breaks up around the level of 2.299, the price may open a path to the resistance level of 2.588, which is located on the upper yellow bound. We should bear in mind that this scenario is an alternative one.