
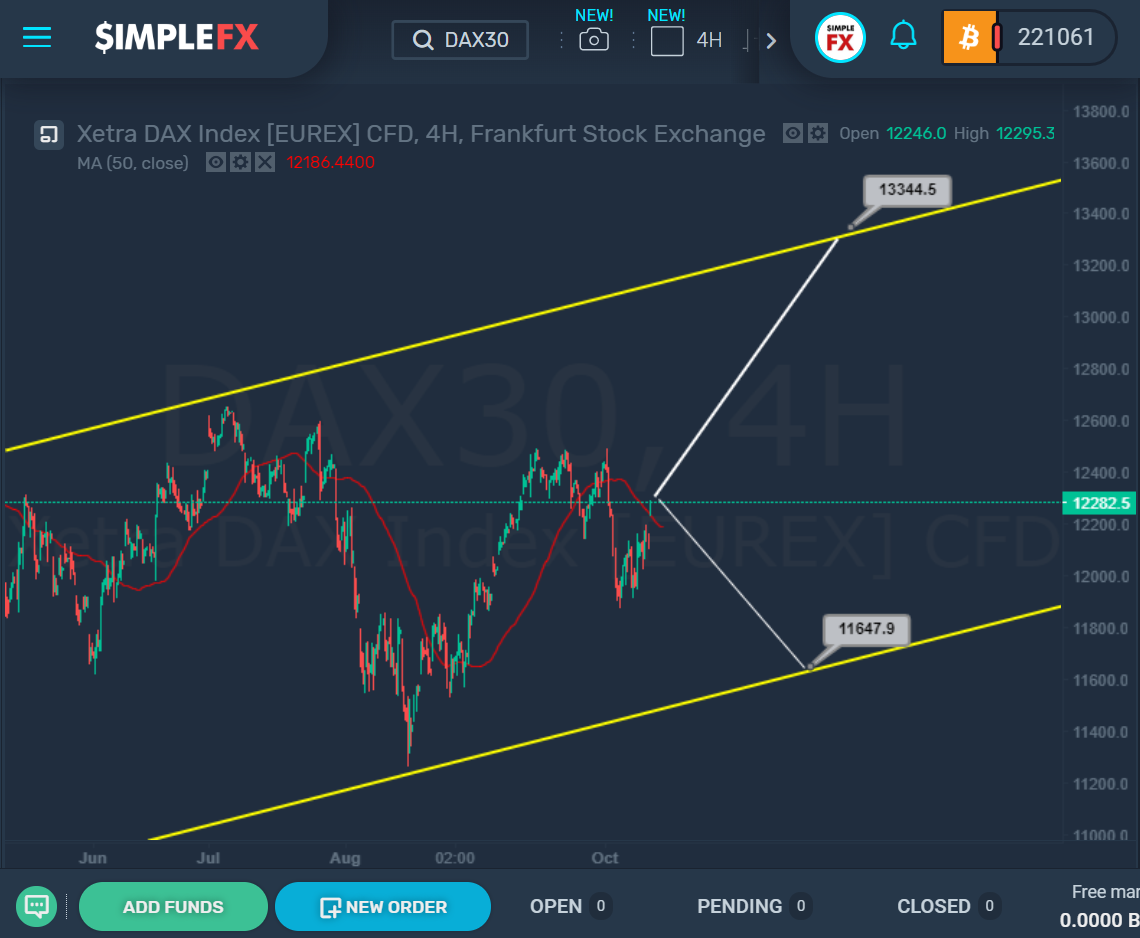
 Most likely, at the moment we see an upward movement of the market from the lower bound of the yellow channel to its upper wall. If the assumption is correct, the growth in the direction of the resistance level of 13344 will continue in the near future. However, if the price breaks above the moving average marked in red on the chart and fixes below it, then the price may open a path to the support level of 11647, which is located on the lower yellow wall. But this option is an alternative, so the price movement of this option is schematically depicted on the chart with a thin white line.Most likely, at the moment we see an upward movement of the market from the lower bound of the yellow channel to its upper wall. If the assumption is correct, the growth in the direction of the resistance level of 13344 will continue in the near future. However, if the price breaks above the moving average marked in red on the chart and fixes below it, then the price may open a path to the support level of 11647, which is located on the lower yellow wall. But this option is an alternative, so the price movement of this option is schematically depicted on the chart with a thin white line.