


Bitcoin broke through the $4000 floor at the end of November dragging down Ripple, Ether, Dash, and other altcoins. What’s going to be next? Where’s the bottom? Will cryptocurrency market recover? When will it happen?
These are all very difficult questions to answer. We are sailing uncharted waters. Luckily, there are still rules that apply to any kind of trading no matter what you are buying or selling. These are the technical analysis fundamentals that will help you make a profit whenever the price goes up or down.
In this post, I’ll show you how to determine the support and resistance price levels for an instrument using the Fibonacci Retracement.
Why does it work? Is it some kabbalah or magic behind the mistery discovered in middle ages? No. Although there is some beautiful mathematics behind the Fibonacci number, the reason it’s so useful in finance is more about a self-fulfilling prophecy.
Fibonacci Retracement levels are based on the “golden ratio” that occurs in nature. The ratio is used in arts, architecture, and trading, most importantly by big institutional investors. These people are not there to experiment. They use standard proven trading tactics to minimize the risk. Their basic set of methods includes the Fibonacci ratios.
This makes Fibonacci Retracement a very useful tool for small investors.
What are retracements?
Retracement is a short-term price correction in an upward or downward trend. Identifying them correctly allows you to enter the trend at a better price – optimize your entry points and exit points. Buy lower opening a long position or sell higher opening a short position.
Retracements are short price corrections. When the price goes up the green candle bars sequence is almost always interrupted by red candle bars. These are traders that decide to take profit. The same happens in downward trends.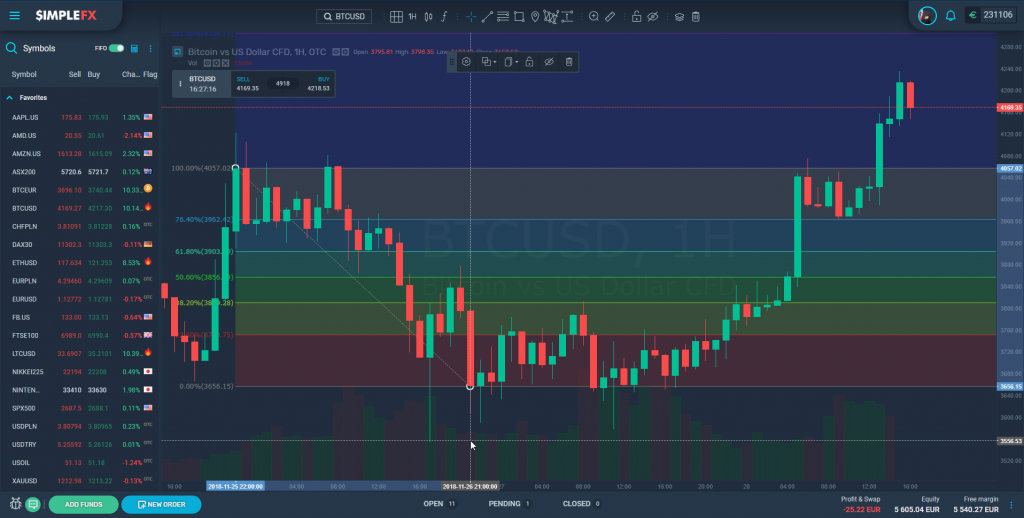

The usually short corrections are retracements. They are usually easy to predict for a skilled trader using Fibonacci Retracement Tool.
Here’s a short guide on how to benefit from upward or downward trends using Fibonacci Retracement. With SimpleFX WebTrader it’s really easy and will help you make an effective trading plan.
Drawing Fibonacci Retracements on a chart
With SimpleFX WebTRader the Fibonacci Retracements tool is really very easy to use, nevertheless, what separates good traders from great are the details.
You can adapt the Fibonacci Retracement Tool to any scale and timeframe. The key is to identify the trend correctly. Here’s an example.
Let’s take a look at how Fibonacci Retracements worked on a recent 1-hour BTCUSD chart. First, choose Fib Retracements from the toolbar. Every quality trading platform offers this tool.
Second, find a strong one direction price movement you’d like to analyze. I choose a strong downward trend you can see on the chart below.
Third, draw a line. With Fib Retracement tool active I click on the swing high (the top of the highest green candle bar) at $4056,96 and then I click on the swing low (the bottom of the lowest red candle bar).
That’s it. I have my Fibbonaci Retracement levels marked. Now, let’s move to the most tricky part – how to read it and how to use the tool to make better day trading decisions.
[button link=”https://app.simplefx.com/login” size=”medium” target=”new” text_color=”#eeeeee” color=”#3cc195″]Make a Trading Plan with Fibonacci Tool[/button]
How to use Fibonacci Retracement levels
You can see how after reaching the swing low the BTCUSD price rises up (making a so-called rally) just to reach the first Fibonacci level of 23,60% that is $3750,75. Then it starts falling back down over the next hour.
At the moment traders still don’t know if these are just retracements and the downward trend will continue or maybe the trend has already reversed. In fact, over the next 24 hours, the price oscillates between the bottom and the first fib level to finally make a breakthrough and reverse the trend and go high up breaking the previous swing high barrier.
In what is now a clear strong upward trend, our Fibonacci Retracement application can help us make more money. There are several pullbacks visible just before the BTCUSD chart reaches each one of the fib levels we drew before. With this simple trick, we are able to predict the market just because everybody else uses it.
In the chart, you can also clearly see that passing the 50% fib level of $3856,50 turned out to be a strong sign for the traders to buy. At this moment it was clear for them that the trend had reversed and it’s time to open long positions on BTCUSD. Some big fish were using basic technical analysis rule of thumb.
Making a trading plan
Fibonacci Retracement levels will help you draw a basic trading plan. It’s still not enough to win all the trades, but it’s definitely a step in the right direction.
You can plan ahead and set up a convenient stop loss and take profit levels for your orders. It’s always a good idea to partially close your positions at these levels.
You will still have to learn how to find the right strong movement, recognize a retracement from the trend reversal, find the right level and wait for a confirmation for a larger trend, read when the price is going to break through the level or nake a pullback or a rally.
Fibonacci Retracement is one of the most basic technical analytics methods. It shows you the crucial points where you have to make the decision to buy, sell, reduce or double your position. Log into SimpleFX WebTrader and start practicing trades using fib levels. See if you can distinguish a retracement from a reversal or predict correctly what price action happens at each level – either a break or a rejection.
[button link=”https://app.simplefx.com/login” size=”medium” target=”new” text_color=”#eeeeee” color=”#3cc195″]Try to Predict Trends[/button]


