
SimpleFX Webtrader offers the most useful technical analysis tools. You can find them all on the top bar menu.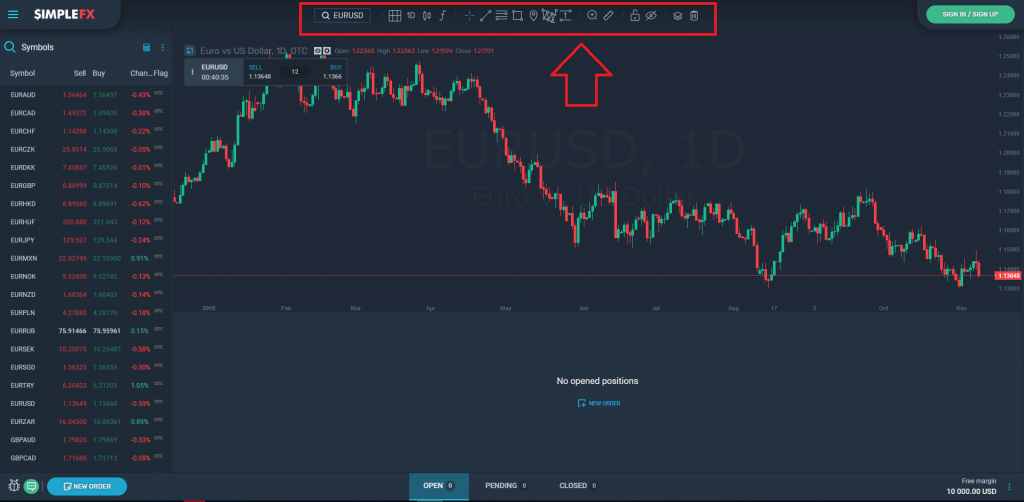
In this post, I’ll walk you through each of the technical analysis tools.
Functions and indicators
Let’s start with basic functions. Click the “f” icon to find various indicators, including:
- Moving Average
- Bollinger Bands
- Parabolic SAR
- MACD
- RSI
- Stochastic Oscillator
- Average True Range
- Intraday Momentum Index
- Volume

You may turn on any of them. The indicators currently in use will be displayed in the top left corner of the graph.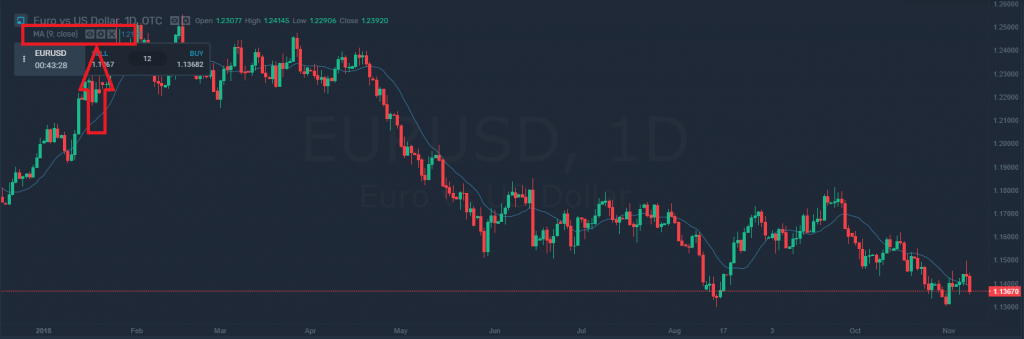 Next to the tool’s name you can see 3 icons:
- The first one (the eye) will turn on/off the display of the indicator
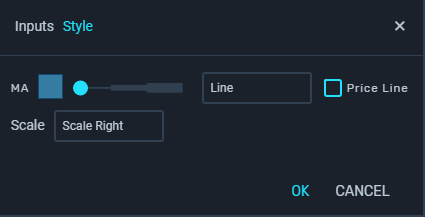
- The second one (the cog) will open settings for the indicator. You can customize each tool setting color, display options, and scale
- The last icon will remove the indicator from the graph
Drawing tools
To the right from the functions icon, you can find several drawing tools – trend lines, rectangles, triangles, polylines, ellipses, arcs, Three Drivers Patterns, Fibonacci Retracement indicators, and price range markers. All of them can be customized.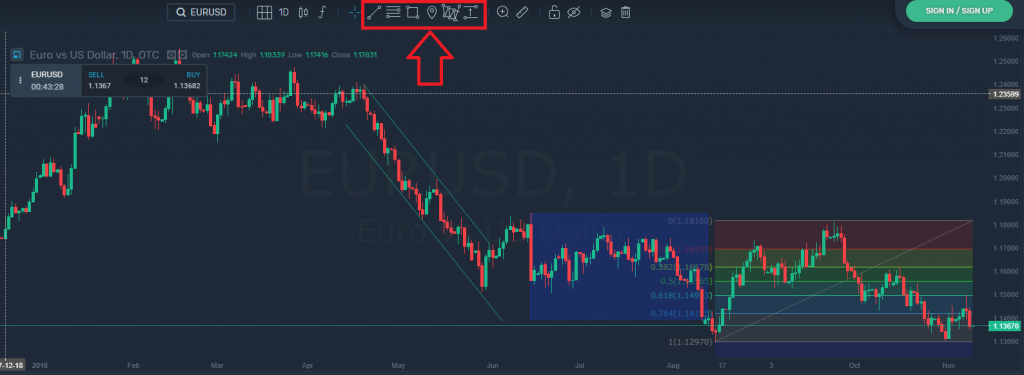
You can add multiple indicators to the same chart and later decide which one you want to keep visible. The easiest way to manage your drawing tool options is to use one of the last icons from the toolbar.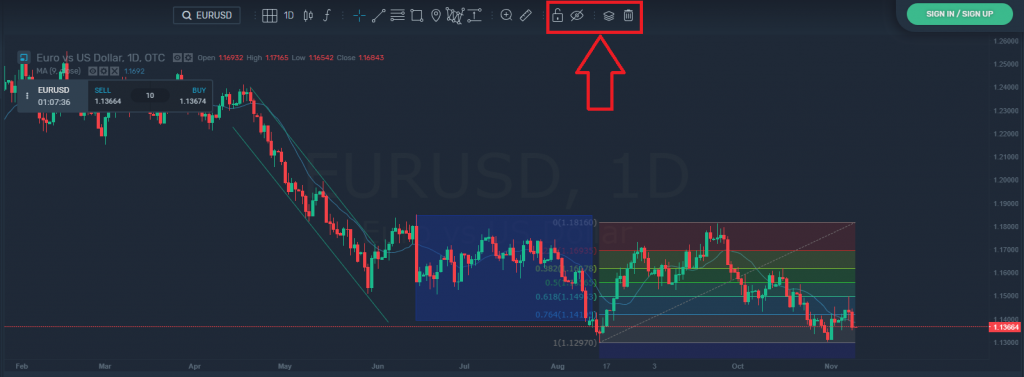
With these buttons you can:
- lock your drawing tools by clicking the lock icon
- hide or display all of your drawings by clicking the eye icon
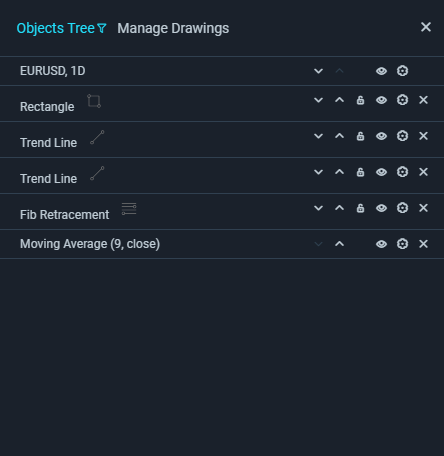
- manage the display of each drawing using the object tree
- delete all of your drawings by clicking on the trash bin icon.
Don’t be afraid to experiment and play with the technical analysis tools. Some of them are very intuitive, the others require some time to understand properly. In the next tutorials, we’ll explain them to you one by one.
Have fun with SimpleFX WebTrader!