
")
This week, the US will provide data on inflation, consumer confidence, and the housing market that could influence financial markets. Tuesday will see the release of the January Consumer Price Index (CPI) and a hearing by the US Senate Committee on Banking, Housing, and Urban Affairs on cryptocurrencies and digital assets. Wednesday will see the release of January retail sales figures, and Thursday will see the publishing of the Producer Price Index (PPI) and January building permits and housing starts. These events could significantly impact market trends and financial decisions, so grab some hints about the TOP3 investing opportunities this week (February 13-17).
Here Are TOP3 Investing Opportunities This Week (February 13-17):
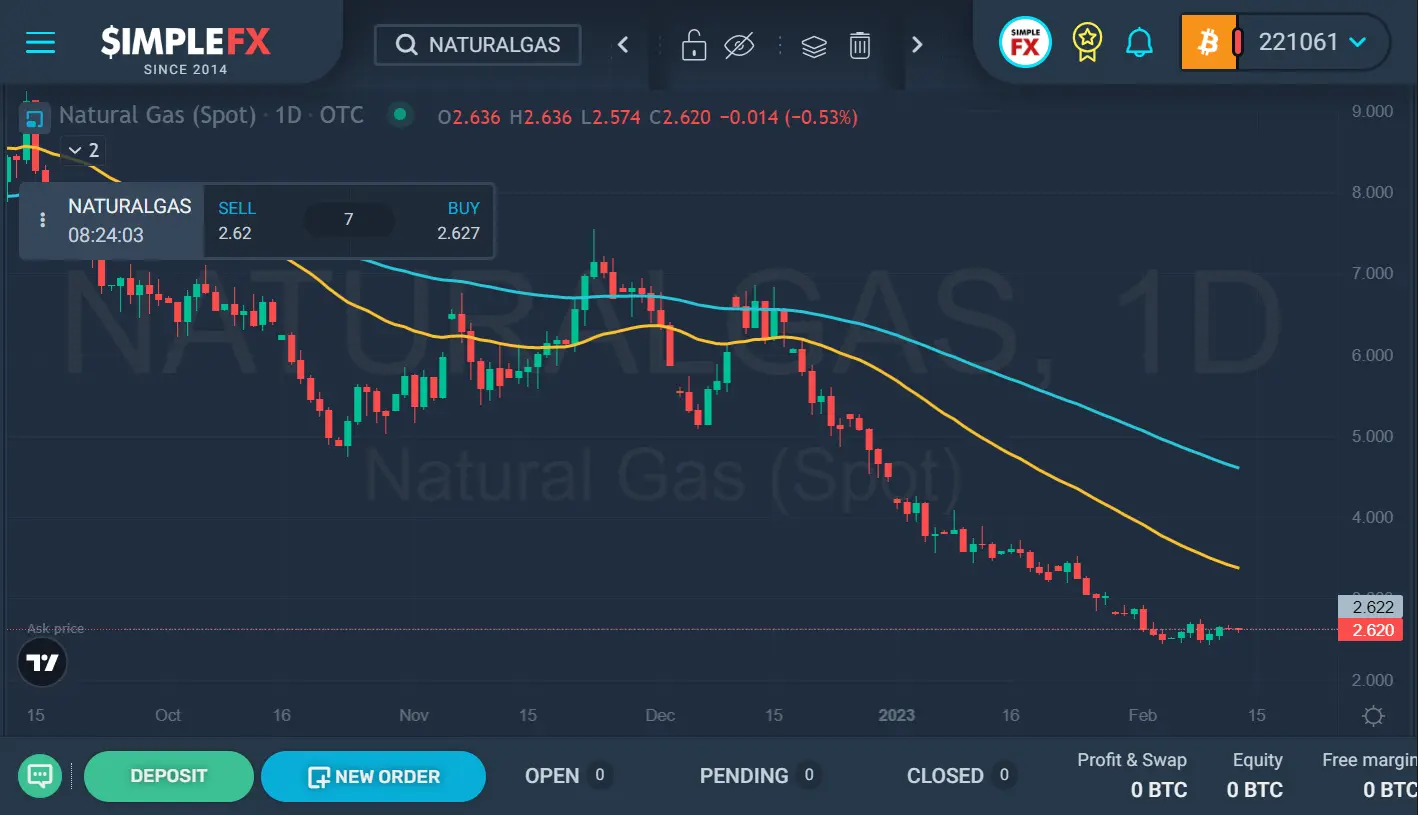
Natural Gas
Despite a slight increase in prices last week, the trend over the past year has been consistently downward, and natural gas prices are still unable to clear a fundamental support level. The bearish Head & Shoulders pattern is also a concern, as it could mean potential testing of lows from 2020.
Considering these factors, natural gas prices may face further pressure shortly. If prices reach the target of the Head & Shoulders pattern, it could result in a test of the 2020 lows between 1.44 and 1.61. Until prices can clear the March 2021 low and show signs of stability, it is wise for traders and investors to expect increased volatility.
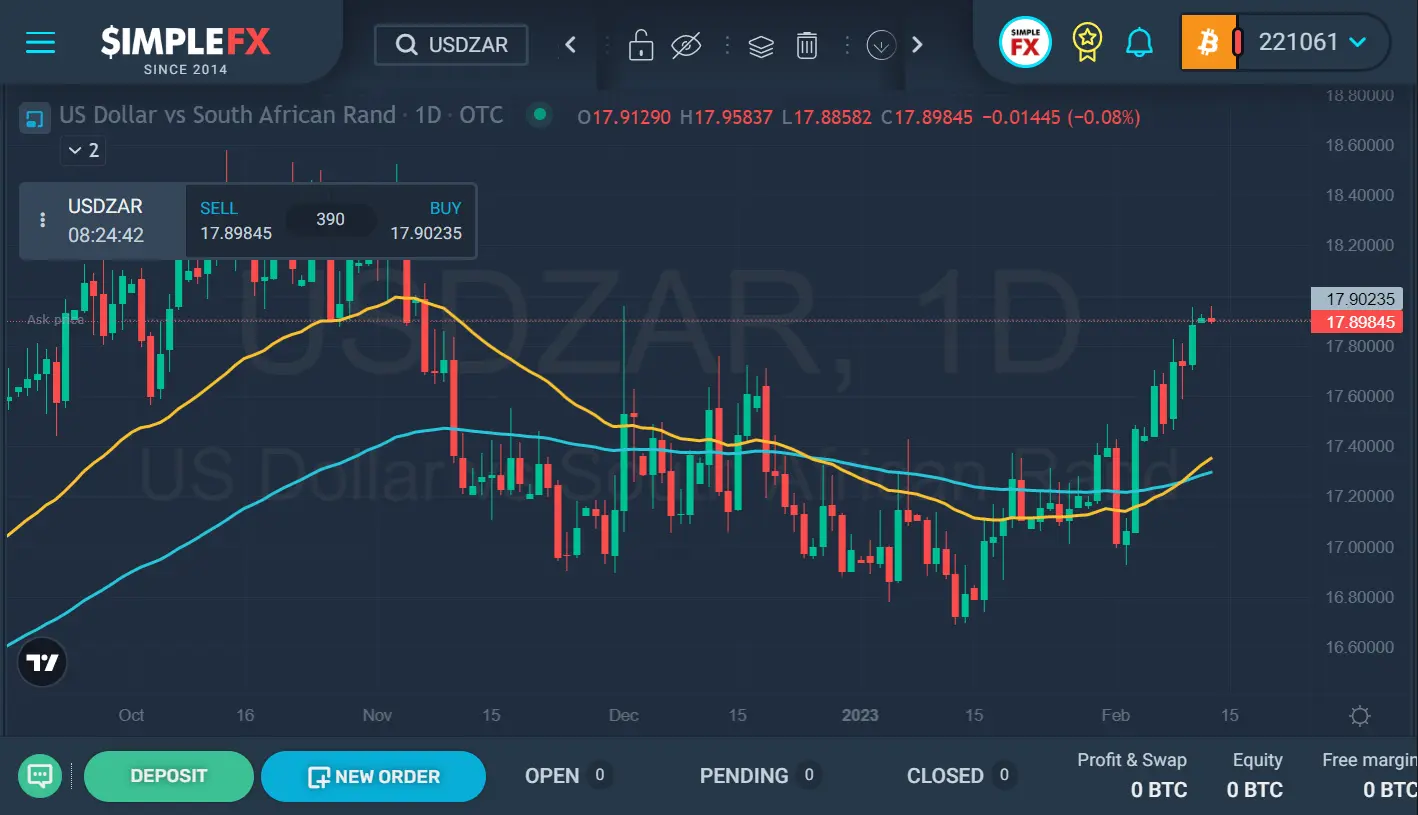
USDZAR
The recent breakout above the 17.75 ZAR level and the formation of a “U pattern” suggest that the market may build bullish momentum. If the market can continue to move higher, the US dollar may reach the 18.50 ZAR region.
However, it is essential to remember that the South African Rand is a highly volatile emerging market currency. Risk aversion may play a role in its value. Based on commodities and investment in Africa, the global growth situation and the South African economy will likely influence the market participants’ decisions to buy or sell the US dollar.
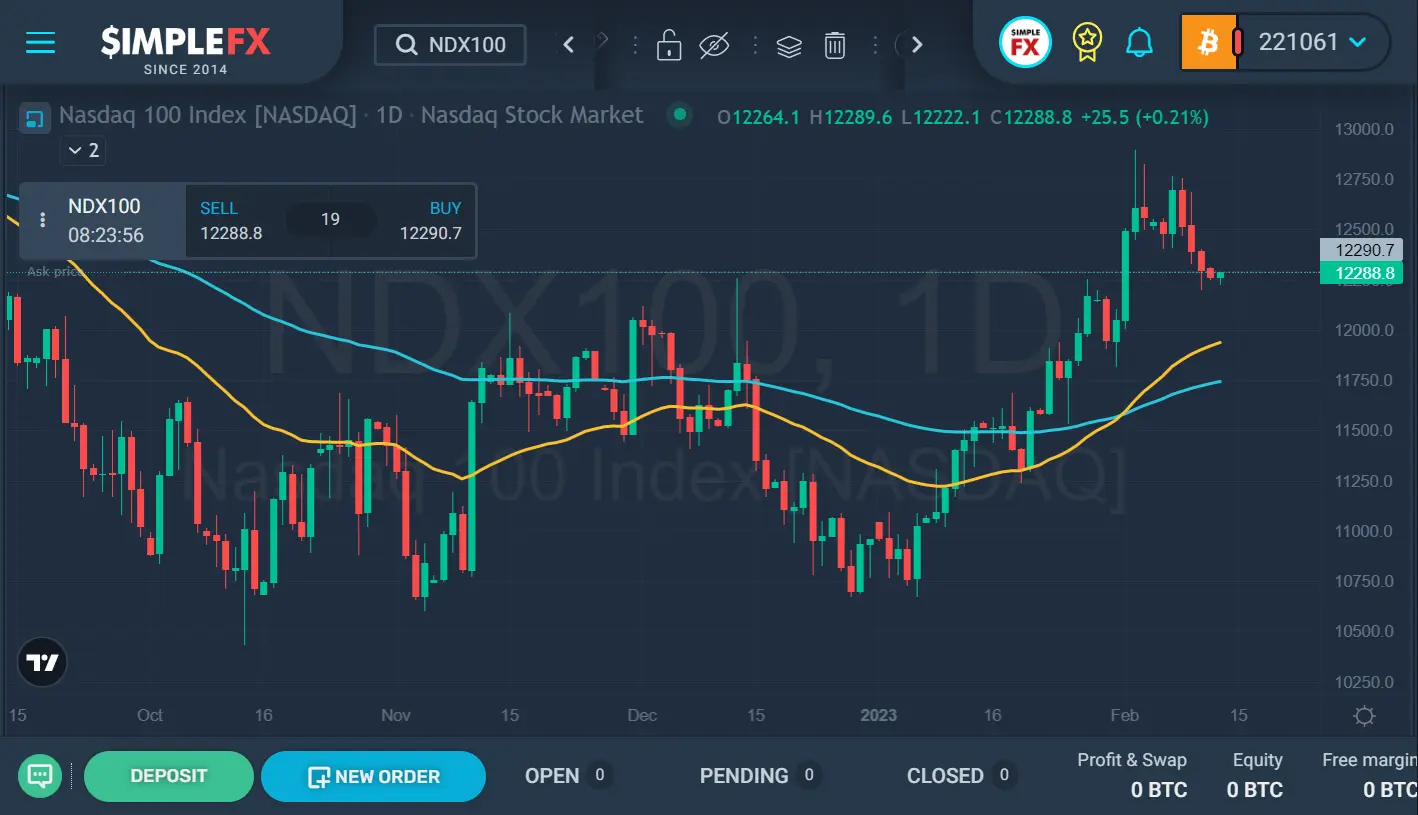
NDX100
The upcoming critical economic data releases are expected to impact the market. It includes the Consumer Price Index (CPI) report, retail sales figures, and the Producer Price Index (PPI) statistics.
Suppose the inflation rate remains far off the Fed’s 2% target rate, and the rate of decline is slower than expected. In that case, US stocks, particularly the NASDAQ 100 index, may experience a further downside. However, the upcoming economic data releases show improvements over their previous prints and come above or equal to forecasts. In that case, this could lead to a hawkish Federal Reserve and be detrimental to stocks.
Take Advantage of Opportunities in the Global Financial Markets with SimpleFX
In conclusion, it is crucial for traders and investors to closely monitor the upcoming economic data releases. It is also important to understand their potential impact on the NASDAQ 100 index and the US stock market.
You can trade these assets with SimpleFX daily. Make sure you take advantage of every opportunity in the global financial markets. With SimpleFX, it’s easier than ever before.