

We are observing an unprecedented dollar run against all currencies and asset classes. Despite the global rivals (euro, yuan), and cryptocurrency alternatives, during the geopolitical and economic crisis of 2022, all the capital flows to cash, and the money is the US dollar. The EURUSD parity has been broken, and the downfall continues. Let’s take a look at the EURUSD technical outlook.
Key Support Levels for EURUSD Technical Viewpoint
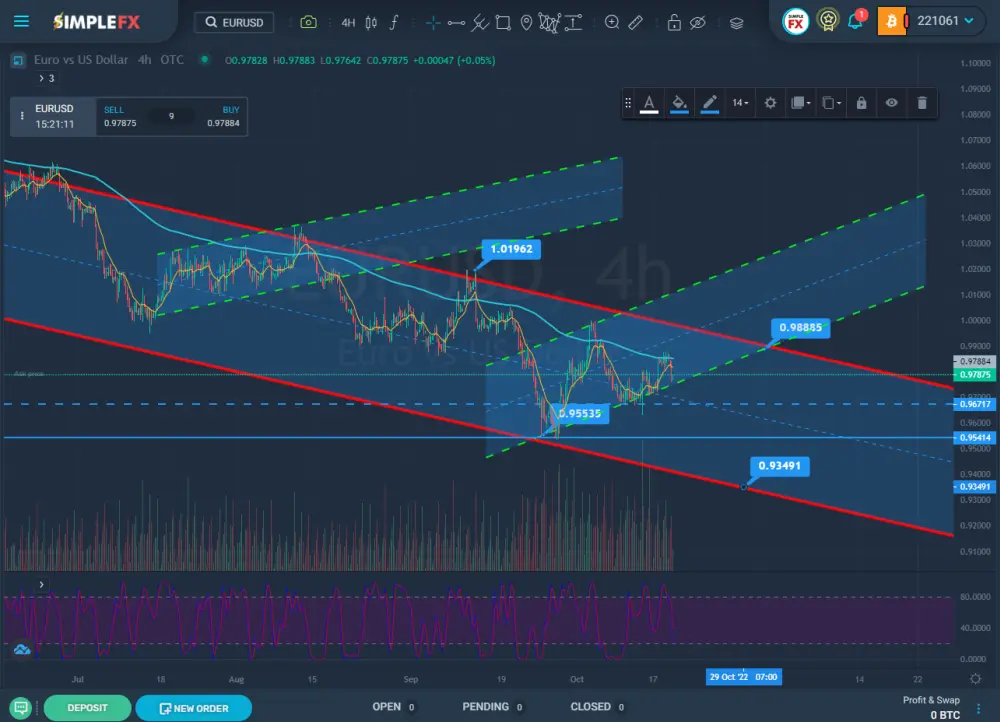
The stochastic RSI (StochRSI) suggests that the pair may be oversold at $0.978. As presented on the 4-hour chart, the price action continues to enclose within the red bearish channel. These lines hooked on the long-term highs and lows. We can still see any signals that would suggest a trend reversal. We can observe short-term support for the EURUSD at $0.967 (the blue dotted line) and $0.955 (the continuous blue line).
Traders who are bearish on EURUSD could consider these levels a suitable take profits, while the bulls may consider buying in at any of these.
In the case of the resistance level for the EURUSD, we can pinpoint an area ranging from $ 1 to $ 1.02 with the suggestion of going lower. Why? Because the psychological significance of parity has already been broken.
EURUSD technical outlook for local rallies
The current trend on the leading forex pair has been on since 2021. As you can see, the 100-period moving average (the light blue curve) has been a good marker of the local resistance levels and correctly predicted the level to get off the local rallies.
These will continue to happen with the current bearish sentiment and should fit into the downtrend channel until we see a true rebound and reversal, as it has to happen with time when the US dollar starts to go down. We have marketed two examples of local rallies (green channels), which proved very profitable for SimpleFX traders.
EURUSD Remains Below Horizontal Support From 2017
However, the most crucial fact about the EURSD technical outlook is that the pair remains below the fundamental horizontal support from 2017, the next test will be $0.8225 (the low of 2000), but there is still a long way to go to reach this level.