


The current formation of the DJI30 index shows the development of a global trend that is moving inside a large green channel. On the current chart, we see the price movement since July.
By the second half of August, the bulls reached the upper green line but did not break through it. After that, the market crept down. The last section of the chart describes a bearish yellow channel.
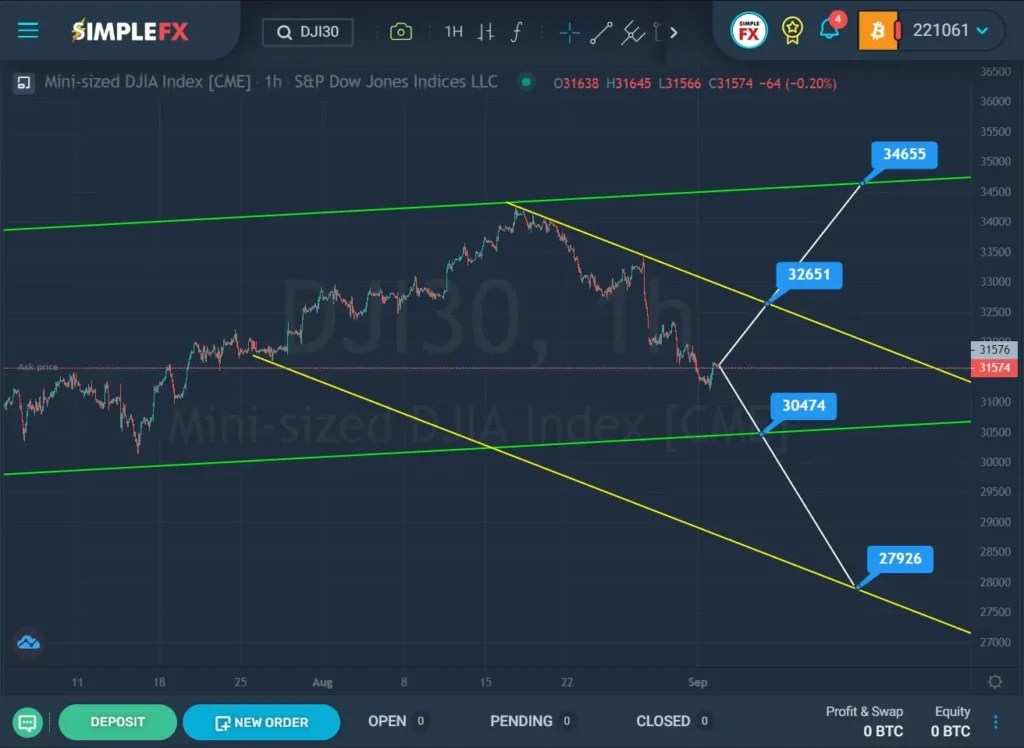

It is assumed that the downward trend will continue to develop, which will move toward the lower green line. Perhaps if the bears can break through the support level of 30474, the downtrend will be confirmed. In this case, market participants will be waiting for the continuation of the downward movement of the price to the next support level of 27926, which is located on the lower green line. In the current situation, it is possible to consider opening short positions.
Alternatively, a bullish trend is expected to develop, where the bulls are aimed at the resistance level of 32651, located on the upper yellow line. If this level breaks, the index may rise to the resistance level of 34655, located on the green channel’s upper wall. In the current situation, it is possible to consider opening long positions.
An approximate scheme of possible future movement is shown on the chart.


