


The structure of the USDJPY currency pair suggests a global bearish trend that moves within the green channel. And the last section of the chart describes a small yellow channel, which can serve as the beginning of a new bullish trend.

On the current chart, we see that at the beginning of this month, the price touched the lower green wall, and then we saw an upward movement of the market in the direction of the upper green line.
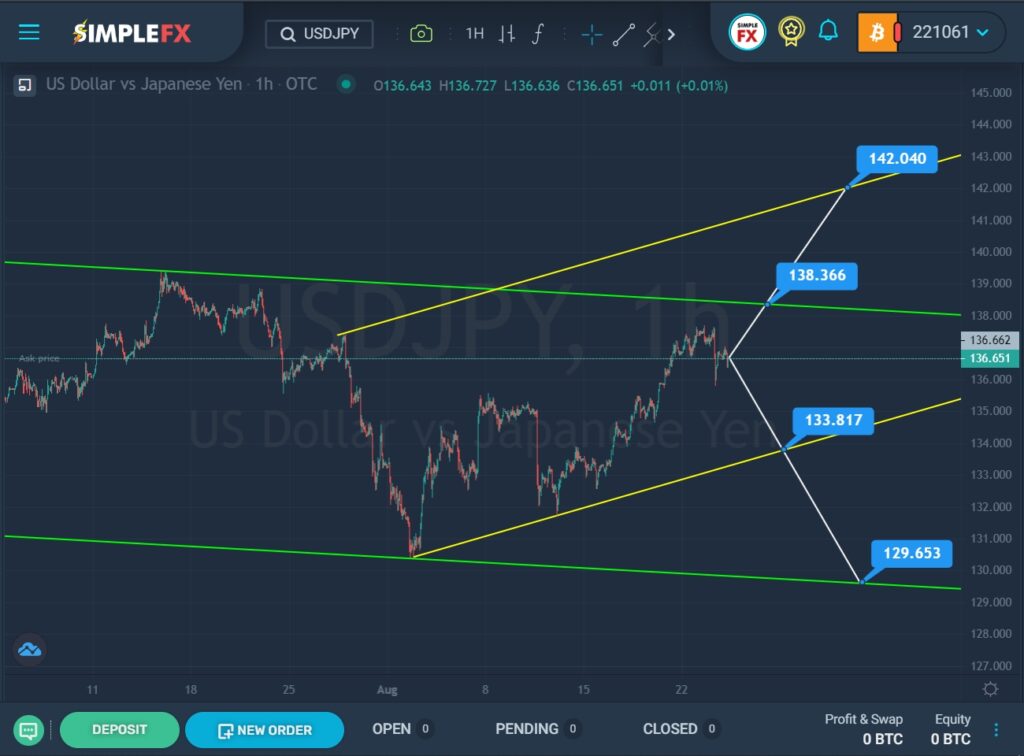
Currently, the price is in the upper green area. With the same pressure of the bulls, the pair may continue to grow to the resistance level of 138.36. If this level is broken, the price of the currency could grow to a higher resistance level, which is located on the upper yellow line, thereby confirming the beginning of a major bullish trend. In this case, it is recommended to consider purchases.
Alternatively, it is assumed that the price will continue to move in a downward direction to the lower yellow line. With a successful breakdown of the support level of 133.81, the bears will open the way to the lower green line and the support level of 129.65. In this case, sales can be considered.
An approximate scheme of possible future movement is shown on the chart.


