


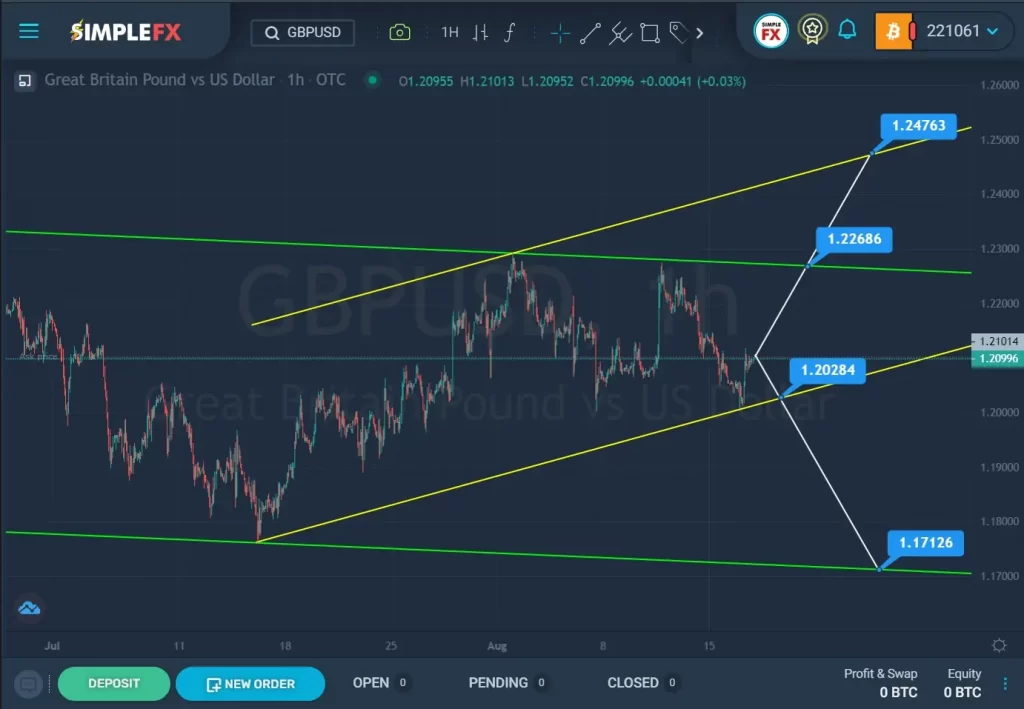

The internal structure of the GBPUSD pair shows the downward movement of the market within a large green channel.
By the middle of last month, the price reached the lower green line. We see that the bears failed to break through the support line, so the price, pushing off from the green line, began to move in the opposite direction within the yellow channel. In early August, the price touched the green wall at the intersection with the upper yellow line. After that, the market rolled back to the lower yellow wall. It is assumed that the price, after a slight correction, will continue to grow in the direction of the upper green line. If the resistance level of 1.226 breaks, the bulls will continue to push the market to the upper yellow line and the resistance level of 1.247
However, there is an alternative scenario. In the second option, bears will dominate the market. Perhaps the price will fall again to the support line of the yellow channel. And if the level of 1.202 breaks, the bearish trend may continue its development in the direction of the lower green wall and the support level of 1.171.
In a downtrend, it is recommended to consider opening sales deals. If the bullish price movement is confirmed, we can make money on purchases.


