


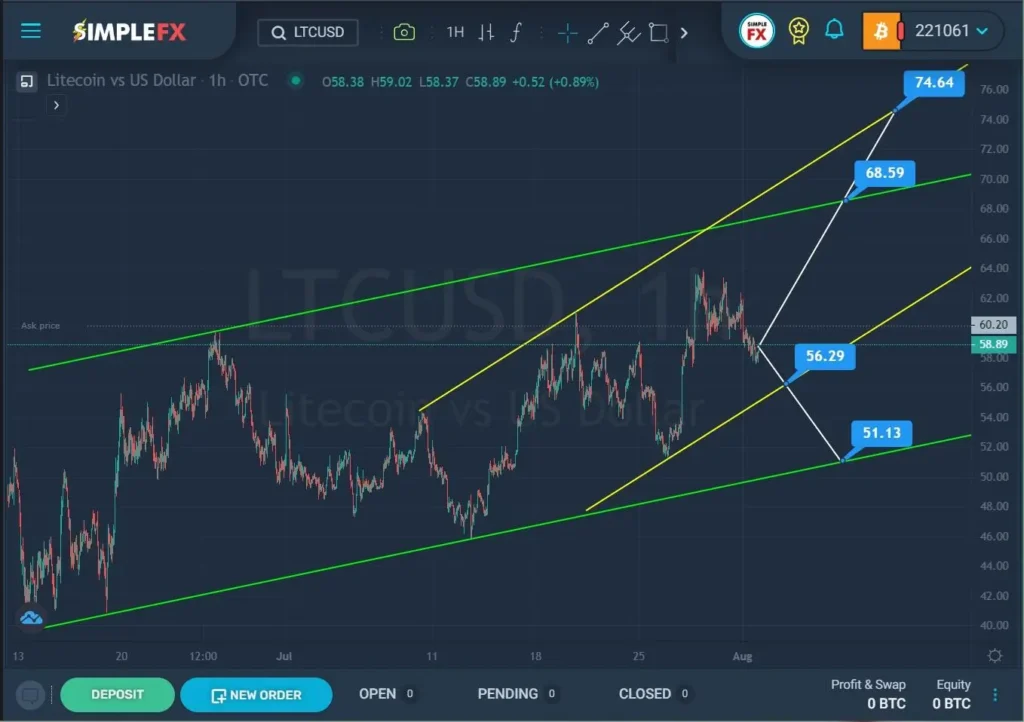

The structure of the LTCUSD cryptocurrency on the 1H timeframe shows the formation of a bullish trend that moves within the green channel.
We see that by the end of June, the bulls were able to bring the market to the upper green wall, but then they did not overcome the resistance line, weakened their positions. Bears have led the market quite actively. In the second half of July, the price fell to the lower green wall. The support line was not broken, so the market turned around and began to move in the opposite direction.
Perhaps the bullish trend will continue in the next coming trading weeks. Thus, when the resistance level of 68.59 is reached and then broken, which is located on the upper green wall, the growth of the cryptocurrency can be continued to the upper yellow line and the resistance level of 74.64.
Alternatively, a bearish trend is assumed. In this case, market participants may expect a downward price movement in the direction of the lower yellow line. If the yellow line near the support level of 56.29 is broken, the decline may continue to the next important support level of 51.13, which is located on the lower green wall.
If the price goes up, it is worth to consider opening long positions. If the bearish trend is confirmed, short positions can be opened.


