


The current structure of Bitcoin shows the formation of a large downtrend that moves inside a large green channel.
By the second half of June, the drop in quotations sharply collapsed from the upper green line to the lower green line. Then, pushing off from the green support line, the market began to gradually move towards the upper green line. Having reached the resistance line of the green channel, the price went into a reversal. This section of the chart describes an ascending channel of yellow color.
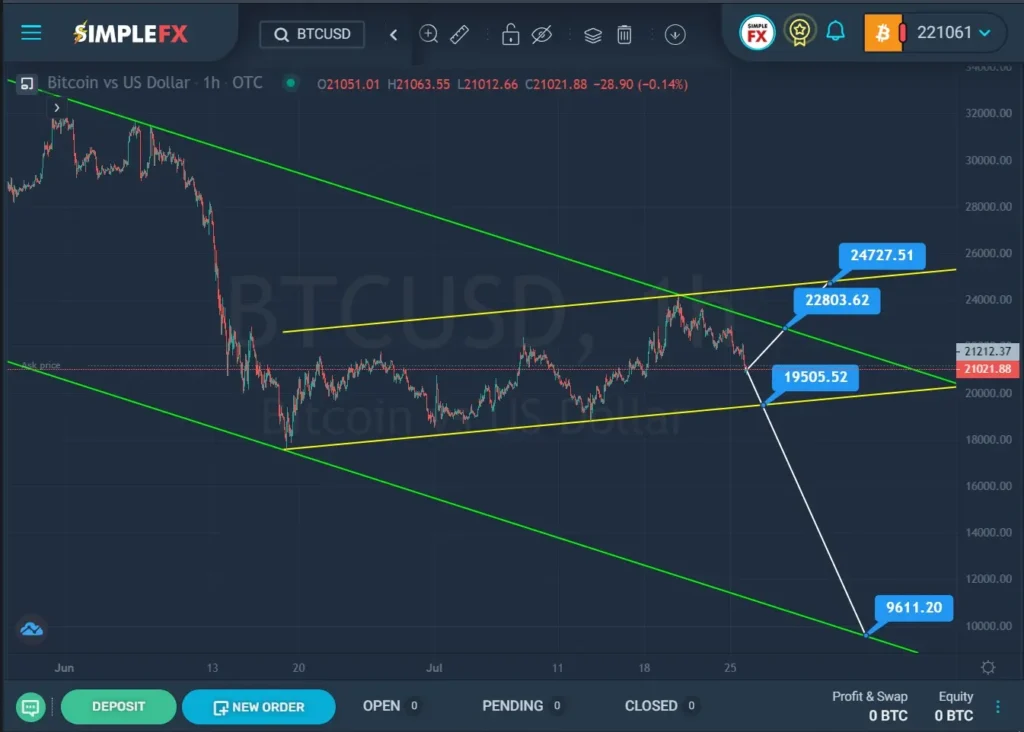

In the last section of the chart, we see that the cryptocurrency is declining in the direction of the lower yellow line. Perhaps the bears are targeting the support level of 19505.52, which is located on the lower wall of the yellow channel. If this level breaks, the cryptocurrency may depreciate to the next support level of 9611.20, located on the lower green line.
Alternatively, market participants may observe a repeated price increase to the upper green line and the resistance level of 22803.62. If this price level is broken, the bulls can bring the market to a higher resistance level of 24727.51, which is located on the upper yellow wall.
With a downward price movement, sales can be considered. With an upward movement – purchases.


