


The current structure of the AUDUSD pair shows the development of a global downward trend within a large green channel.
We see that the price reached the upper green line at the beginning of June. However, the bulls did not have enough strength to continue growing, and we saw a rapid drop in value within the yellow channel. Recently, the price touched the lower yellow line. Then the market began to grow in the direction of the upper yellow line.
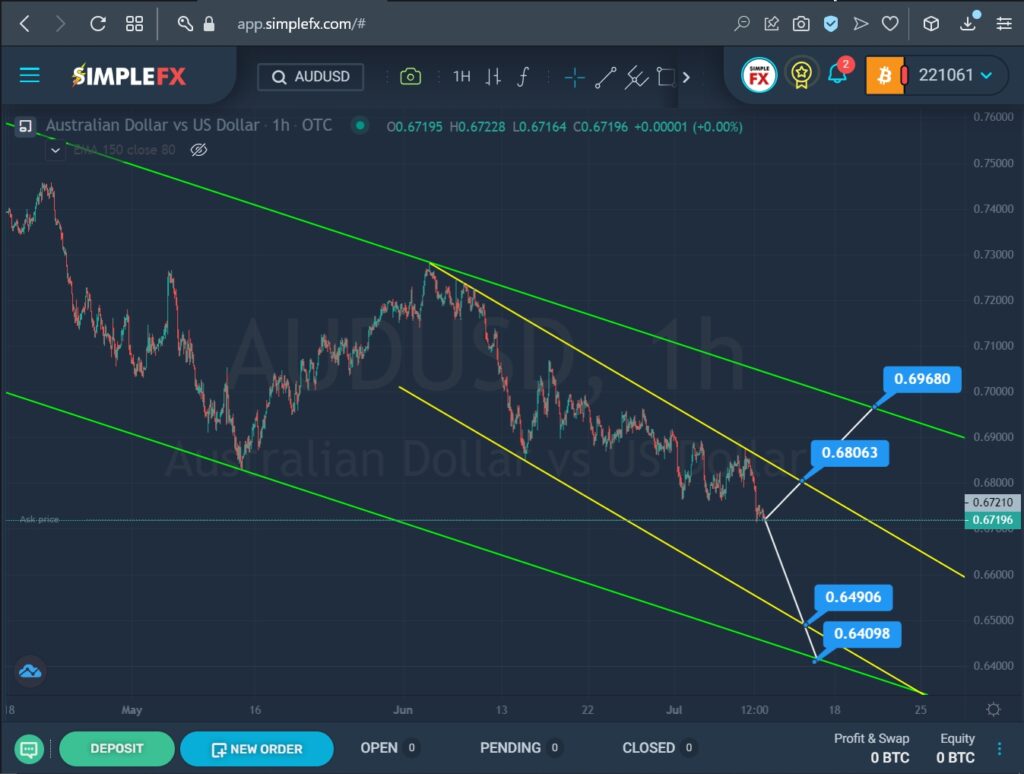

SimpleFX AUDUSD Chart Analysis: July 12, 2022
Currently, the market is located near the upper yellow line. A bullish trend is expected to develop. The first target for bulls is at the upper yellow line– the resistance level of 0.680. If this price level is broken, we can expect continued growth towards the upper green line. The second target for the bulls is the resistance level of 0.696.
Alternatively, there is a possibility of the market falling to the lower green line. The breakdown of the 0.649 level, which is located on the lower yellow line, will serve as confirmation that the trend towards the lower line of the green channel has begun. In this case, nothing will prevent the bears from falling to the level of 0.640.
An approximate scheme of possible future movement is shown on the chart.


