


GBPJPY suggests the formation of an upward trend that moves inside the green channel. The current chart shows the market movement since the end of May this year.

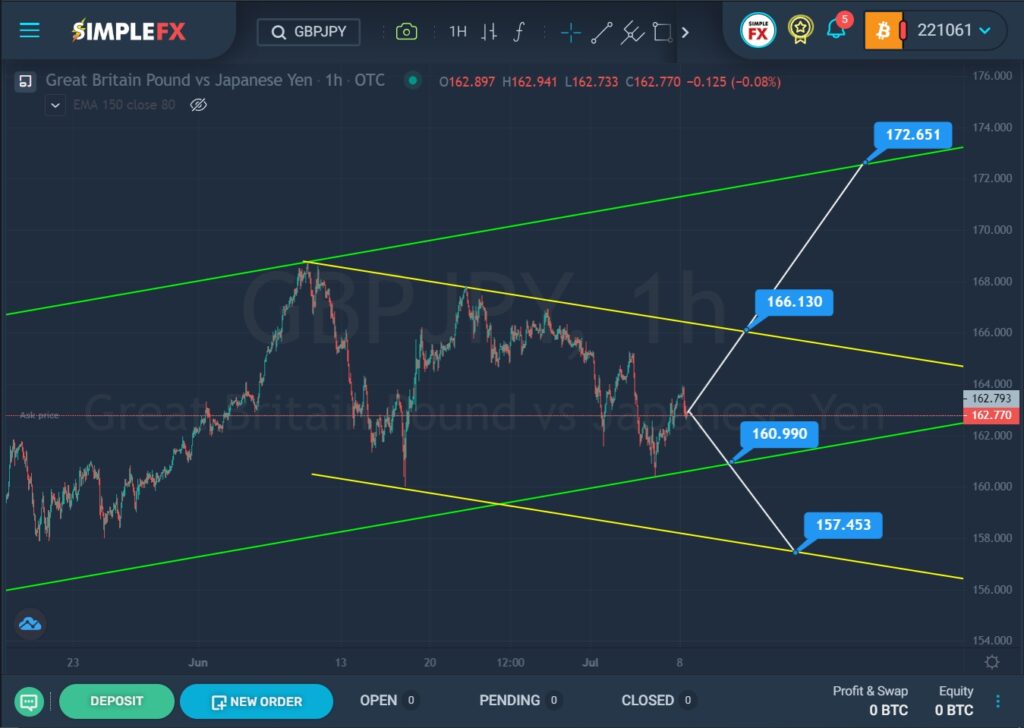
By mid-June, the price rose to the upper green line, pushed off from it, and began falling to the lower green wall. Not so long ago, the market reached the lower green wall, but the bears failed to break through it, so the price began to move in the opposite direction. This period describes a yellow bearish channel.
Currently, the market is located in the lower green area and in the center of the yellow channel. It is assumed that soon the price will reach the upper yellow line. If the bulls can break through the resistance level of 166.13, then the pair will continue to creep up to the next resistance level of 172.65, which is located on the upper green wall.
Alternatively, it is assumed that the bears may make another attempt to break through the lower green line. If the support level of 160.99 is broken, market participants can expect the development of a bearish trend in the direction of the lower yellow line and the support level of 157.45.
An approximate scheme of possible future price movement is shown by trend lines.


