


In the long term, the American stock index SPX500 seems to be forming a major downtrend that moves inside the green channel.

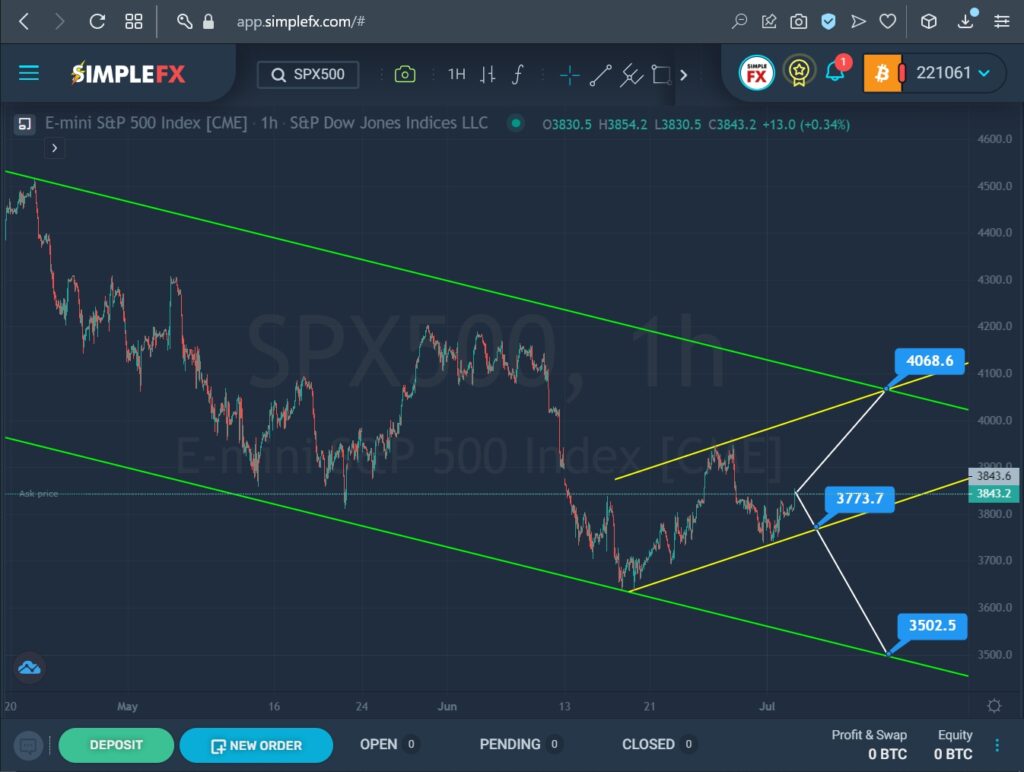
We see that by the end of May, the price reached the lower green area. The bears failed to bring the market to the very line, the price turned around and an upward movement began. However, the bulls also lost their positions before the green resistance line. By mid-June, the price had fallen to the lower green wall. The last ascending section describes a yellow channel.
After the last rebound from the lower green line, the market began to creep up. It is assumed that in the near future the growth will continue in the direction of the upper yellow line and the resistance level of 4068.6. This level is also located on the green wall.
Alternatively, it can be assumed that in the next coming trading weeks the price will move in a downward direction to the lower green line. On the bears’ way, we see the lower yellow line. To confirm the downward trend, the support level of 3773.7 should be broken. If the support level is broken, the bearish trend can be continued to the lower green line and the support level of 3502.5, which is located on it.
We will continue to monitor the index further.


