


The structure of the LTCUSD cryptocurrency in the 1H timeframe shows the formation of a downward trend that moves within the green channel.
Over the past month, the price has been moving along the center of the green channel, then in mid-July, the price fell to the lower green wall, but the bears could not break through the support line. After rebounding from the lower green line, the price began to rise within the yellow channel.

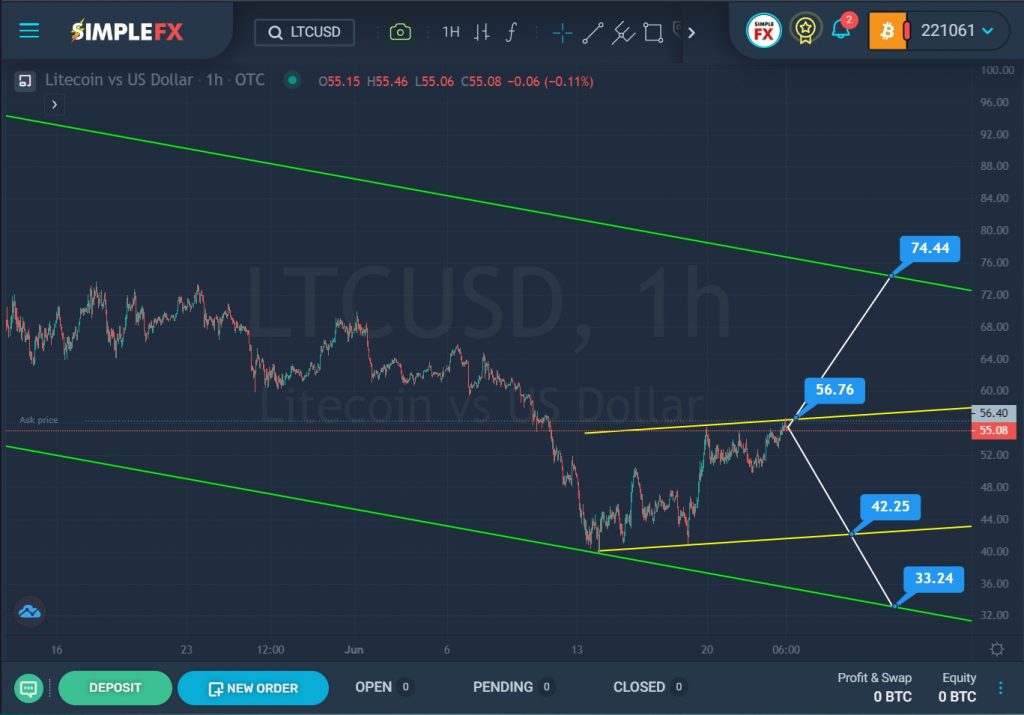
Perhaps the bullish trend will continue in the next coming trading weeks. In the last section of the chart, we can see that the bulls have already made an attempt to break through the upper yellow wall. There is a chance that the yellow resistance line will be broken on the second attempt. Thus, with the breakdown of the resistance level of 56.76, the growth of the cryptocurrency can be continued to the upper green line and the resistance level of 74.44.
Alternatively, it is assumed that the last bounce from the upper yellow line may serve for a bearish trend. In this case, market participants may expect a downward price movement in the direction of the lower yellow border. With a successful breakdown of the yellow border near the support level of 42.25, the decline may continue to the next important support level of 33.24, which is located on the lower green wall.


