


The Federal Reserve meeting is taking place today at 18:00 UTC. The forecast is the Fed will decide to raise the benchmark interest rate from 1% to 1.5%. Yesterday the stock market declined. Get ready for today’s session!
The structure of the DJI30 stock index suggests the formation of a global bearish trend that moves inside a large green channel. On the current chart, we see the price movement since April.
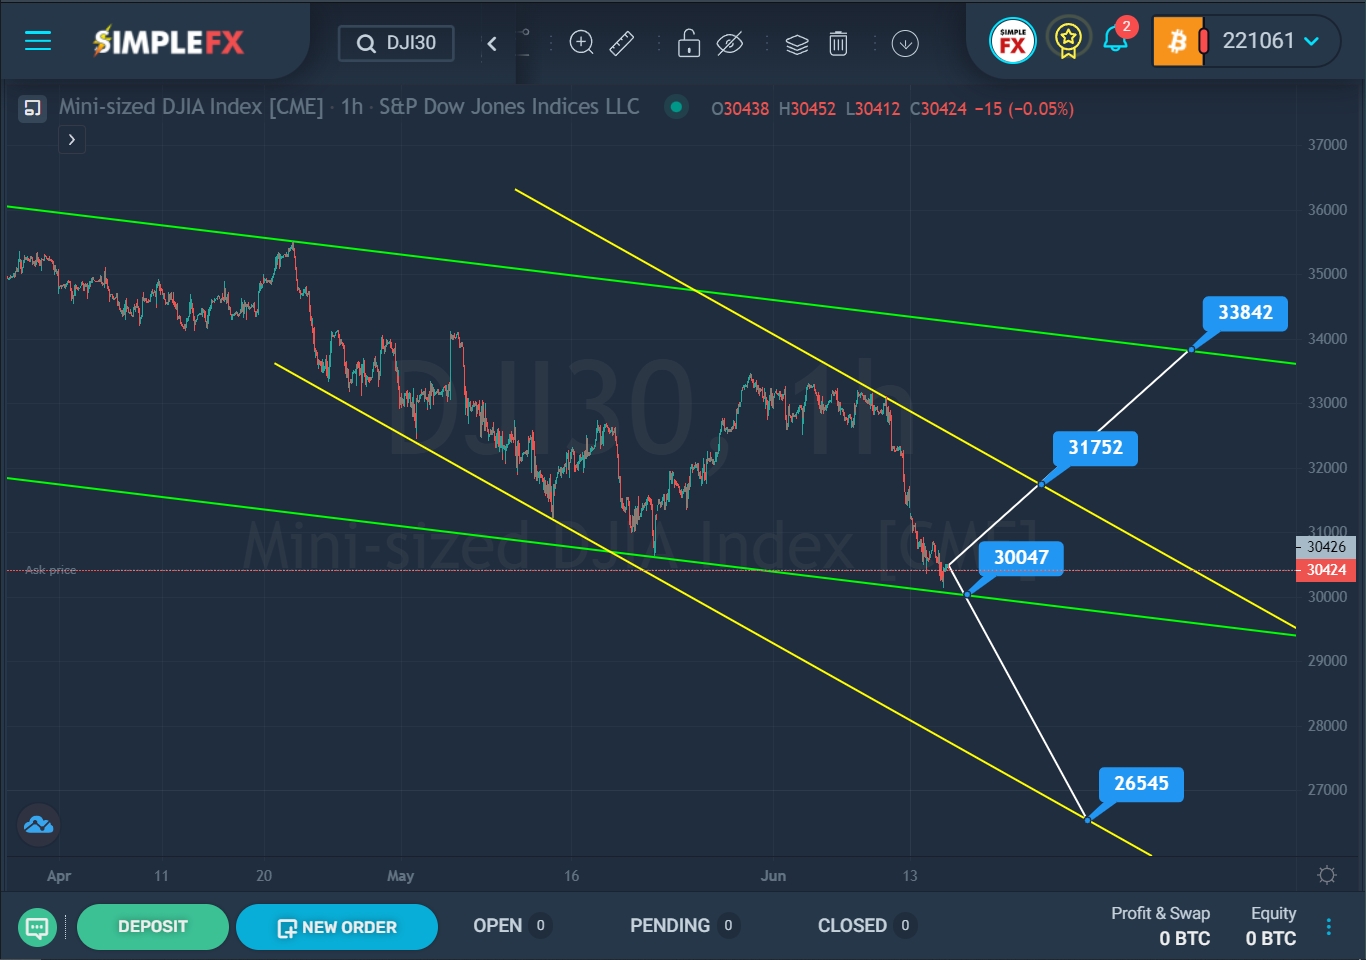

SimpleFX DJI30 Chart Analysis: June 15, 2022.
Until the second half of April, the price moved to the upper green line. At the end of April, the bulls reached the upper green line but did not break through it. After that, the market rapidly crept down within the descending yellow channel.
A few days ago, the bulls reached the upper yellow wall but did not break through it. The price, having pushed off the yellow resistance line, began to decrease.
It is possible that the bulls will make a second attempt to break through the yellow resistance line. If the price mark of 31752 is broken, the index may rise to the resistance level of 33842, which is located on the upper wall of the green channel. In the current situation, it is possible to consider opening long positions.
Alternatively, it is assumed that the downward trend will continue to develop, which will move in the direction of the lower green line. Perhaps if the bears can break through the support level of 30047, the downtrend will be confirmed. In this case, market participants will be waiting for the continuation of the downward price movement to the next support level of 26545, which is located on the lower yellow line.


