


The current formation of the USDCHF currency pair hints at the construction of an upward trend that moves within the big green channel.
In the last section of the 1H timeframe chart, we see a downward movement of the market within the smaller yellow channel, which began after the rebound from the upper green line. Bulls did not have enough strength to break through the resistance line, so bears entered the market.
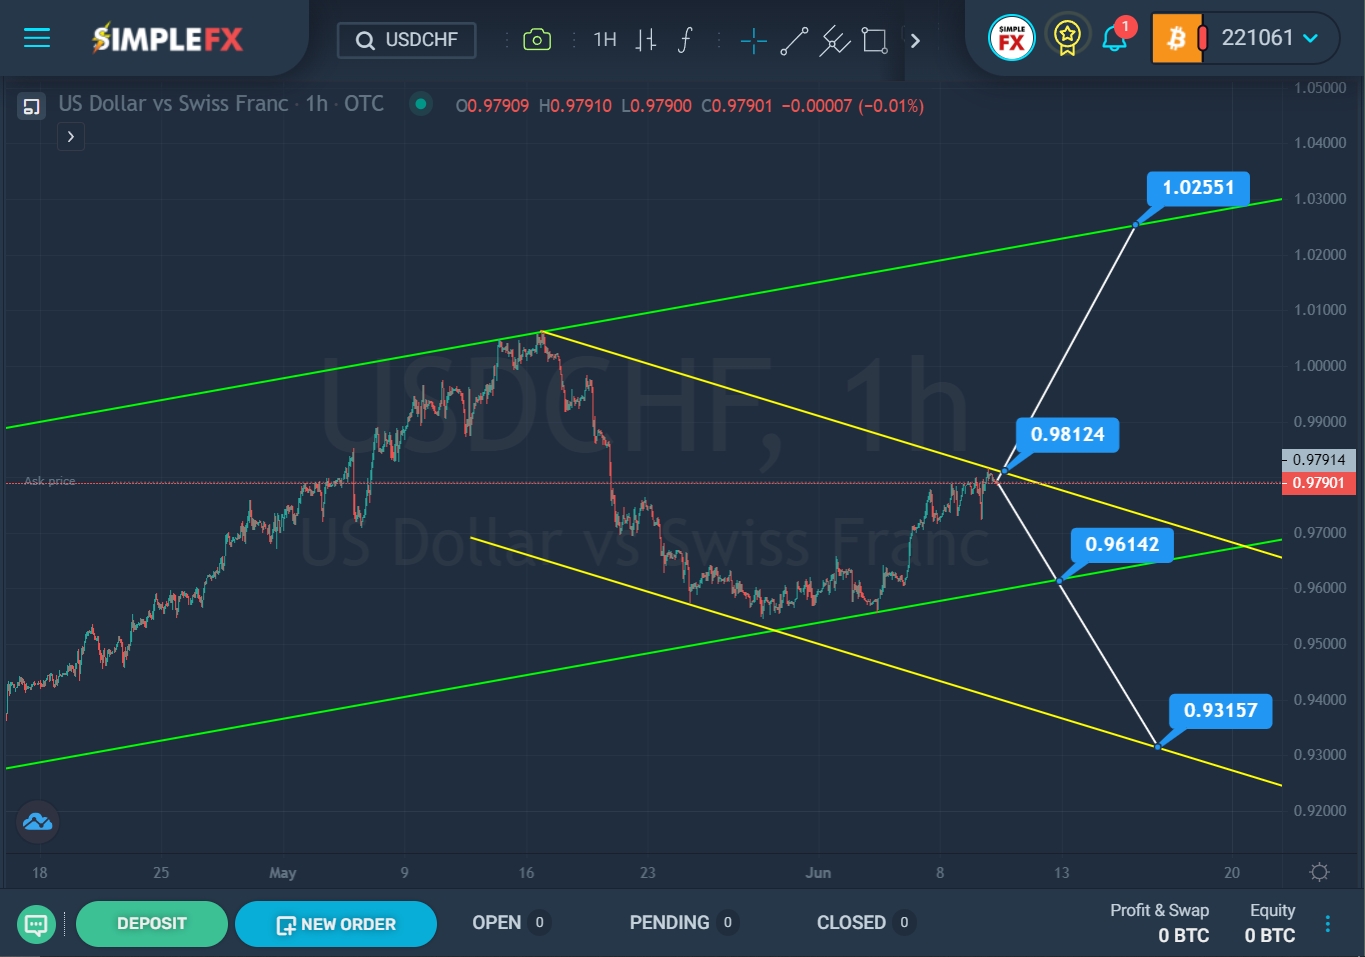

SimpleFX USDCHF Chart Analysis: June 10, 2022.
We see that the price reached the lower green line not so long ago, after which it pushed off from it and went up. We are currently near the resistance line. If the upper yellow line is not broken, the downtrend will resume. A repeated decline to the lower green wall and the support level of 0.961 is expected. With a successful breakdown of this level, the USDCHF pair may depreciate to the level of 0.931, located on the lower yellow line.
Alternatively, we can expect a breakdown of the resistance level of 0.981, which is located on the upper yellow line. In this case, traders can expect the market to grow in the direction of the upper green wall and the next important resistance level of 1.025
An approximate scheme of possible future movement is shown on the chart.


