


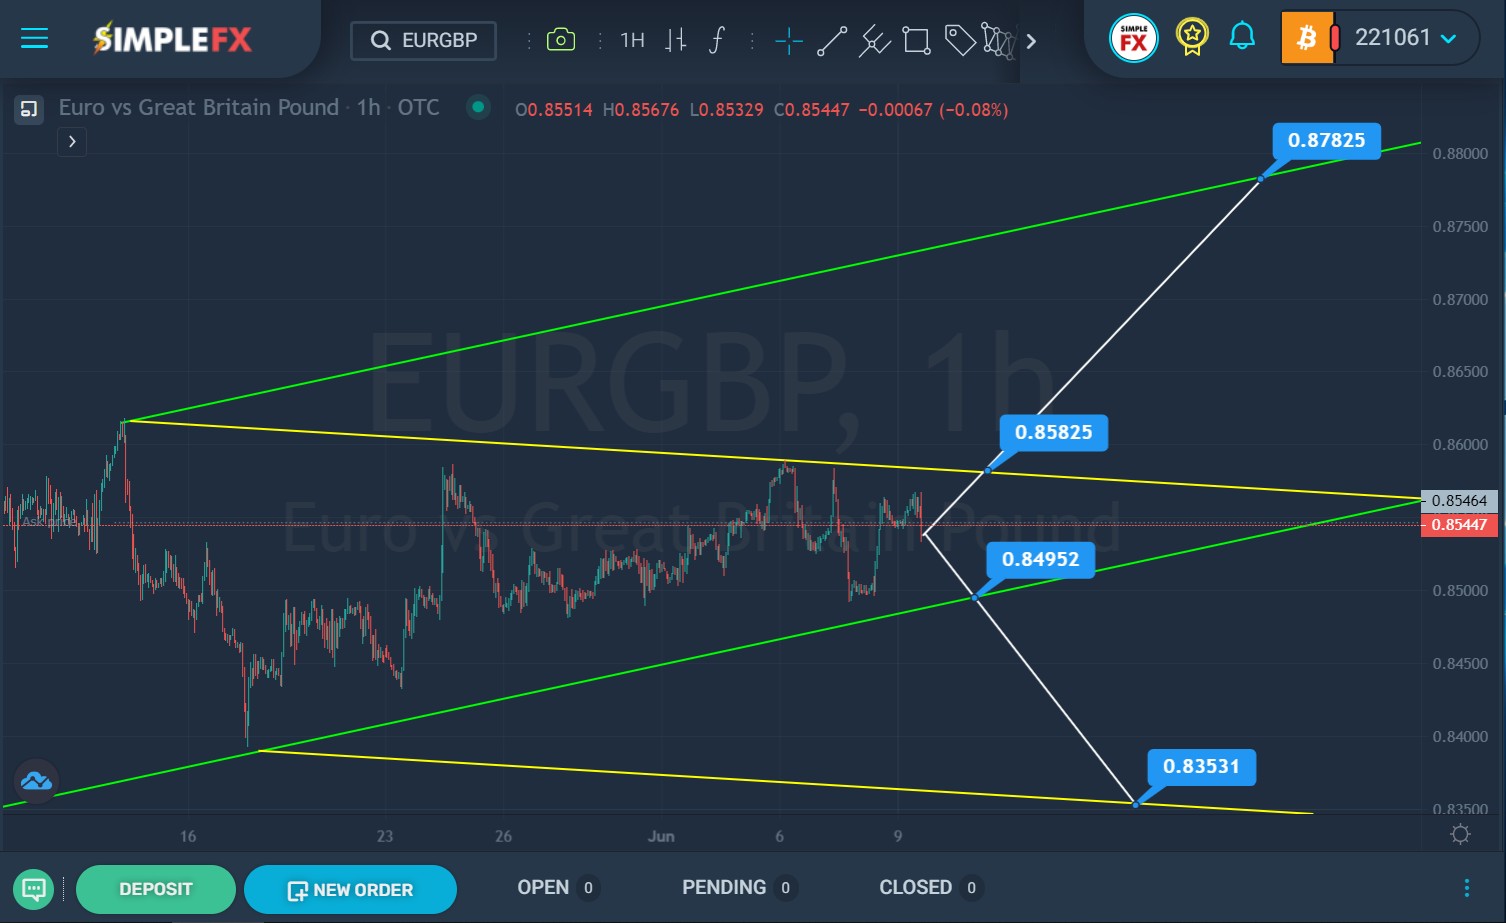
The EURGBP currency pair shows the following dynamics. We see the development of a side wave that moves in an increasingly narrow range. In fact, the price is gradually clamped between the yellow channel’s upper line and the green’s lower wall. This cannot continue indefinitely, for this reason, we may soon see a breakdown of either the yellow or green line.

SimpleFX EURGBP Chart Analysis: June 9, 2022.
If the upper line of the yellow channel and the resistance level of 0.858 are broken, we can see a gradual increase in the price in the direction of the upper line of the green channel and the resistance of 0.878 located on this line.
However, if the bulls do not have enough gas in the tank to push the price up and break through the yellow wall, we can see the activation of the bears and a decline to the lower green wall, and then a breakdown of the support level of 0.849, which is located on this wall. If the support of 0.849 is broken, market participants can expect a gradual decline in the direction of the lower line of the yellow channel and the support level of 0.835.
Possible options for the future movement are schematically shown on the chart. Thank you all for your attention and we wish you profitable trading.


