


Canadian is expected to add over 30,000 jobs in May. The data will be released on May 10 at 12:30 UTC. Let’s analyze the USDCAD chart.
USDCAD seems to be forming an uptrend, which moves inside the green channel.
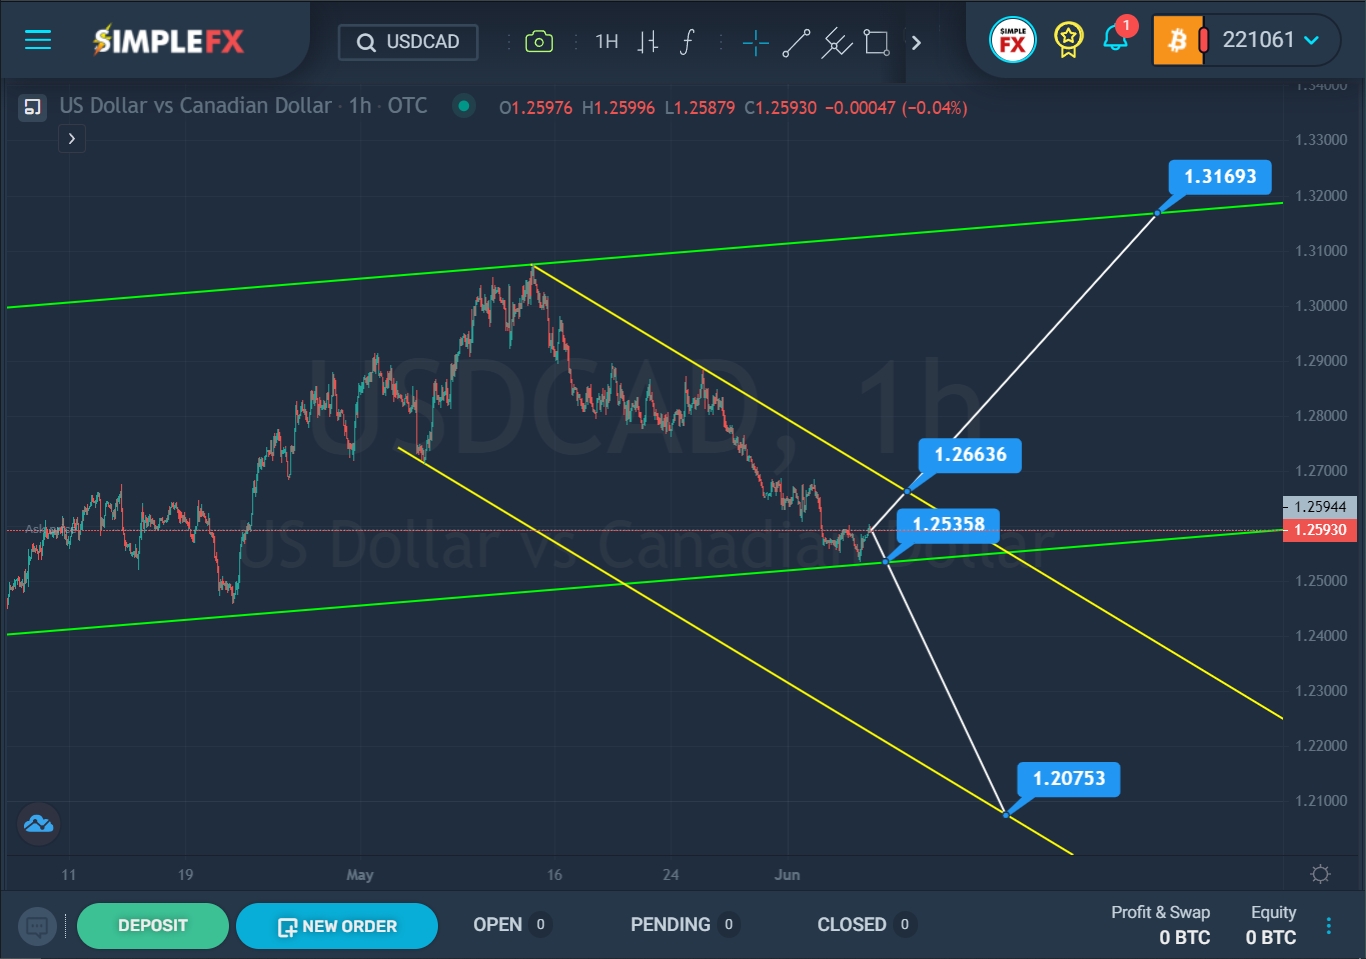
On the current chart, we see that since mid-May, the market has been moving from the upper green line to the lower green line within the yellow channel. Recently, the price touched the lower green wall, then we saw a slight rebound from this wall.

SimpleFX USDCAD Chart Analysis: 7, 2022.
There is a high probability that the bulls will again lead the price up in the direction of the resistance level of 1.266. If this price level is broken, the bullish trend may continue to the next important resistance level of 1.316, which is located on the upper green line.
Alternatively, the downward direction of the price to the lower green line is assumed. With greater pressure on bears, there is a risk of a breakdown of the support level of 1.253, especially since the price is very close to this level. If the lower green wall is broken, then the downward trend will continue its development in the direction of the lower yellow line and the support level of 1.207.
When confirming the bull market, it is recommended to consider opening purchase orders. If the second option is confirmed on the market, then it is recommended to consider opening sales orders.


