


On the current SPX500 chart, a large downtrend is forming in the long term, which moves inside the green channel.
We see that at the end of April, the price touched the upper green line. Bulls could not break through this wall, so bears entered the market. By mid-May, the price had fallen to the lower green wall. This period describes the descending channel of yellow color.
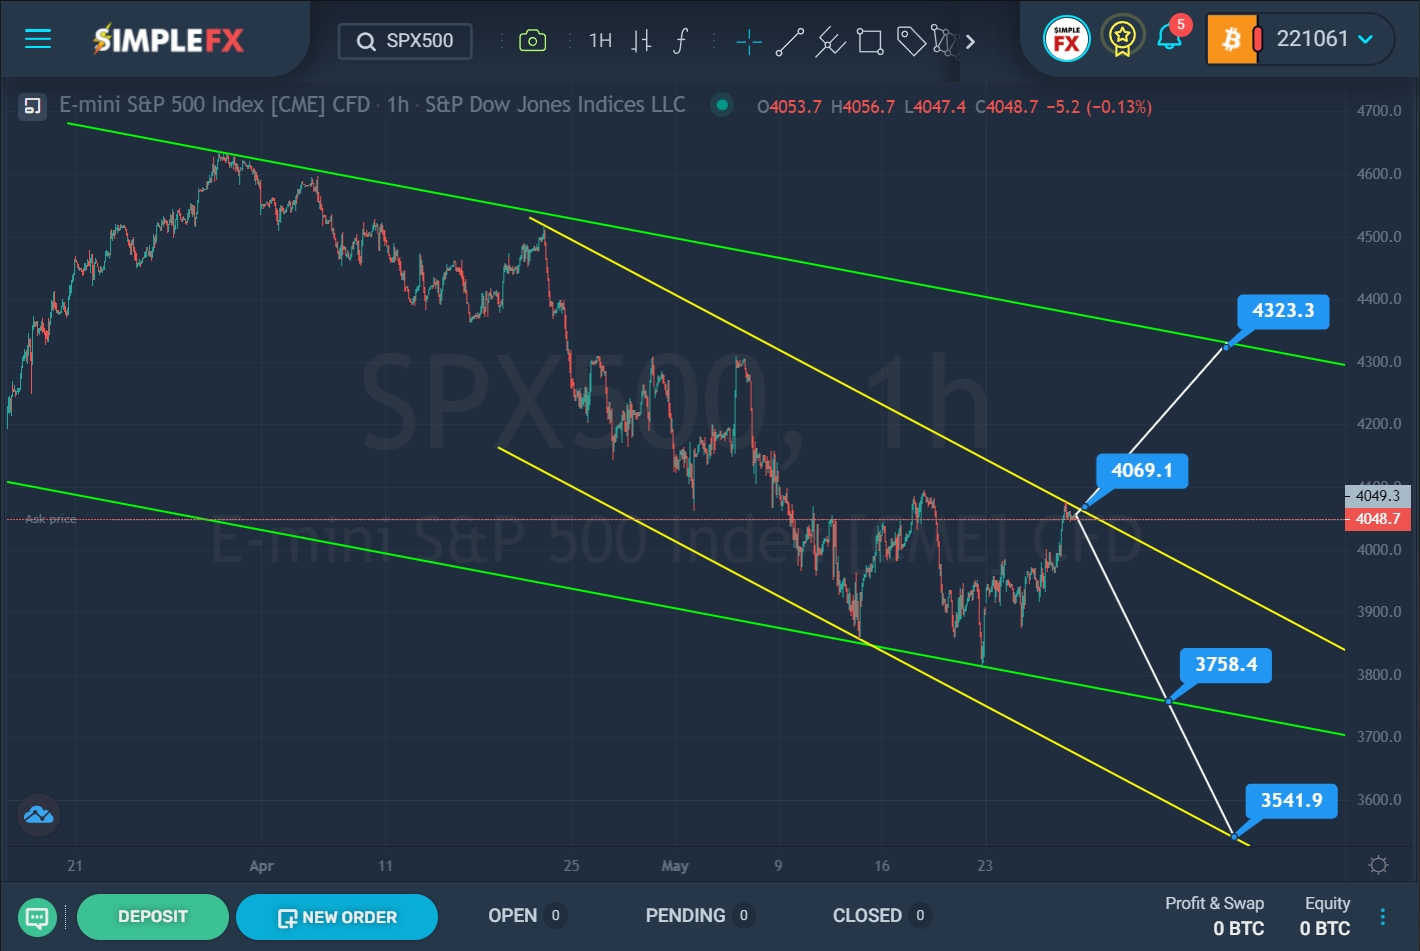

SimpleFX SPX500 Chart Analysis: May 27, 2022.
After the last rebound from the lower green line, the market began to creep up. It is assumed that the growth will continue in the direction of the upper yellow line in the near future. If the resistance level of 4069.1 is broken, the bulls can continue to lead the market to the upper green line and the resistance level of 4323.3.
There is a possibility that the bulls may not have enough strength to hold positions. It is worth considering an alternative option for price movement in this case. It can be assumed that the price will move in a downward direction to the lower green line in the next coming trading weeks. If the support level of 3758.4 is broken, the bearish trend can be continued to the lower yellow line and the support level of 3541.9, which is located on it.
We will continue to monitor the index further.


