


For the ETHUSD cryptocurrency, we see the development of a global trend that is moving in a downward direction within a large green channel.
In the first half of April, the price reached the upper green line, but then pushed off from it and continued its downward movement. A week ago, it touched the lower green support line, after which the bulls entered the market again. The last section of the chart describes an ascending channel of yellow color.
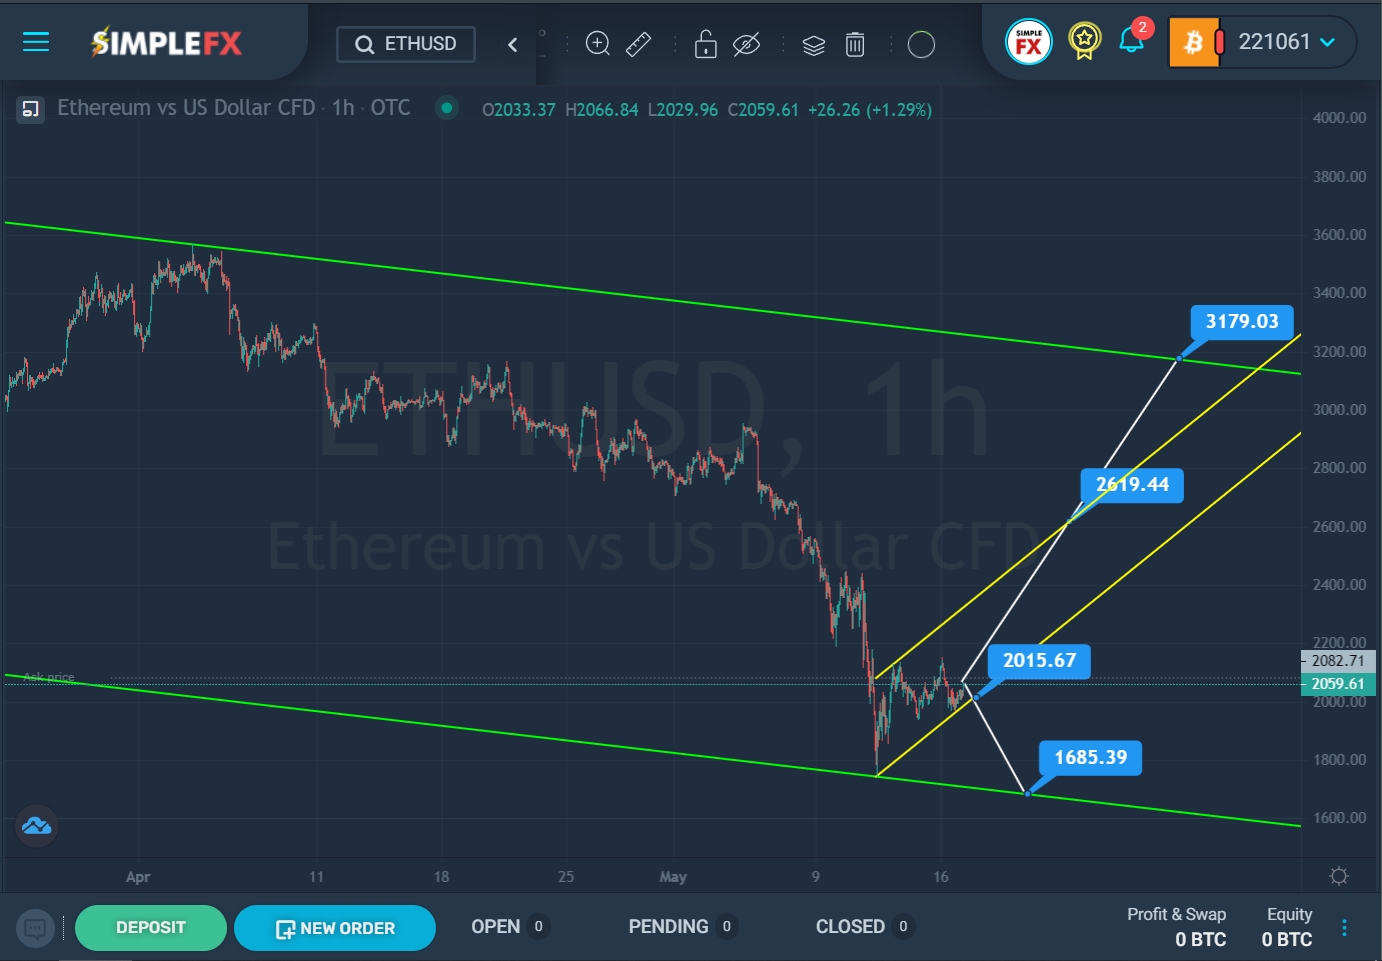

SimpleFX ETHUSD Chart Analysis: May 17, 2022.
Not so long ago, the bulls tried to break through the yellow line, but they did not have enough strength. In a short period of time, the market has reached the lower yellow wall, but so far the support line is holding back the market and does not allow the bears to go further.
Perhaps, after the last bounce from the yellow wall, the price will go up to the upper yellow line, and if the bulls can break through the resistance level of 2619.44, then a path will open for them to the upper green line and the resistance level of 3179.03.
In the second option, market participants may expect a breakdown of the lower yellow line near the support level of 2015.67. In this case, the pair will continue to depreciate. The next important support level of 1685.39 is on the lower line of the green channel.


