


For the USDTRY currency, the market is moving in an upward direction, forming a bullish trend that is formed within a large green channel.

SimpleFX USDTRY Chart Analysis: May 13, 2022
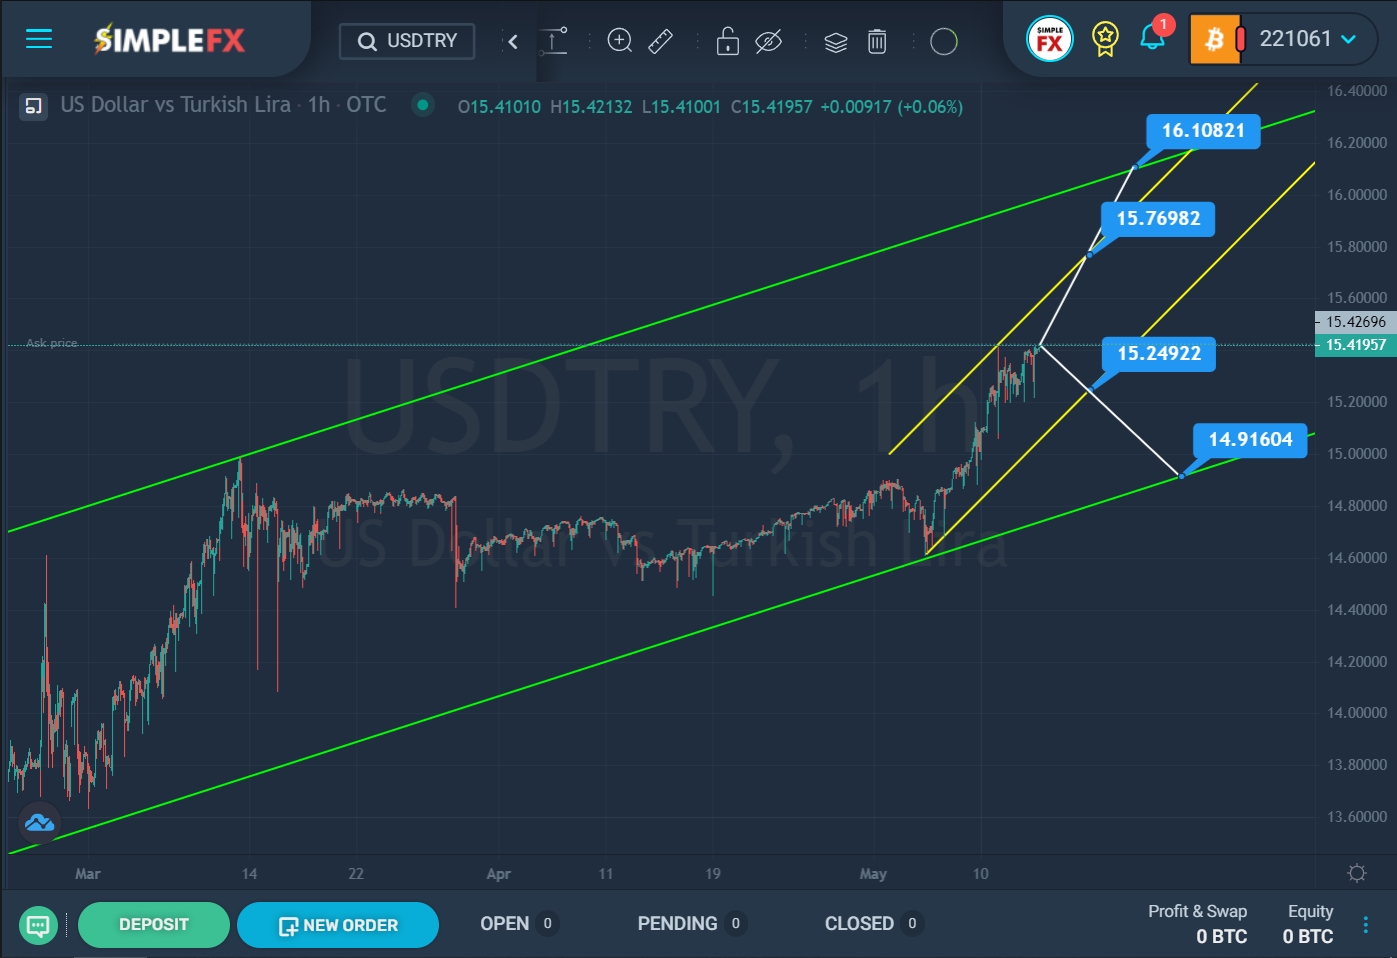
On the current chart, we see that until mid-March there was a rapid growth in the direction of the upper green line. However, when the price touched the upper green line, the bulls could not hold their positions any longer, so the market began to move in the opposite direction.
The chart’s last section describes a descending yellow channel or the last bounce from the lower green line.
Currently, the price is in the upper yellow area. Bulls may have an opportunity to break through the upper yellow line near the resistance level of 15.769. If the yellow line is broken, the currency pair will continue to grow in the direction of the upper green line and the resistance level of 16.108.
Alternatively, it is assumed that the price, having pushed off from the upper yellow wall, will continue to move in a downward direction to the lower yellow line and the support level of 15.249. At the breakdown, the pair may depreciate to the price level of 14.916, which is located on the green support line.
With an upward movement, we can earn money by opening long positions. With a downward price movement, we can consider opening short positions.


