


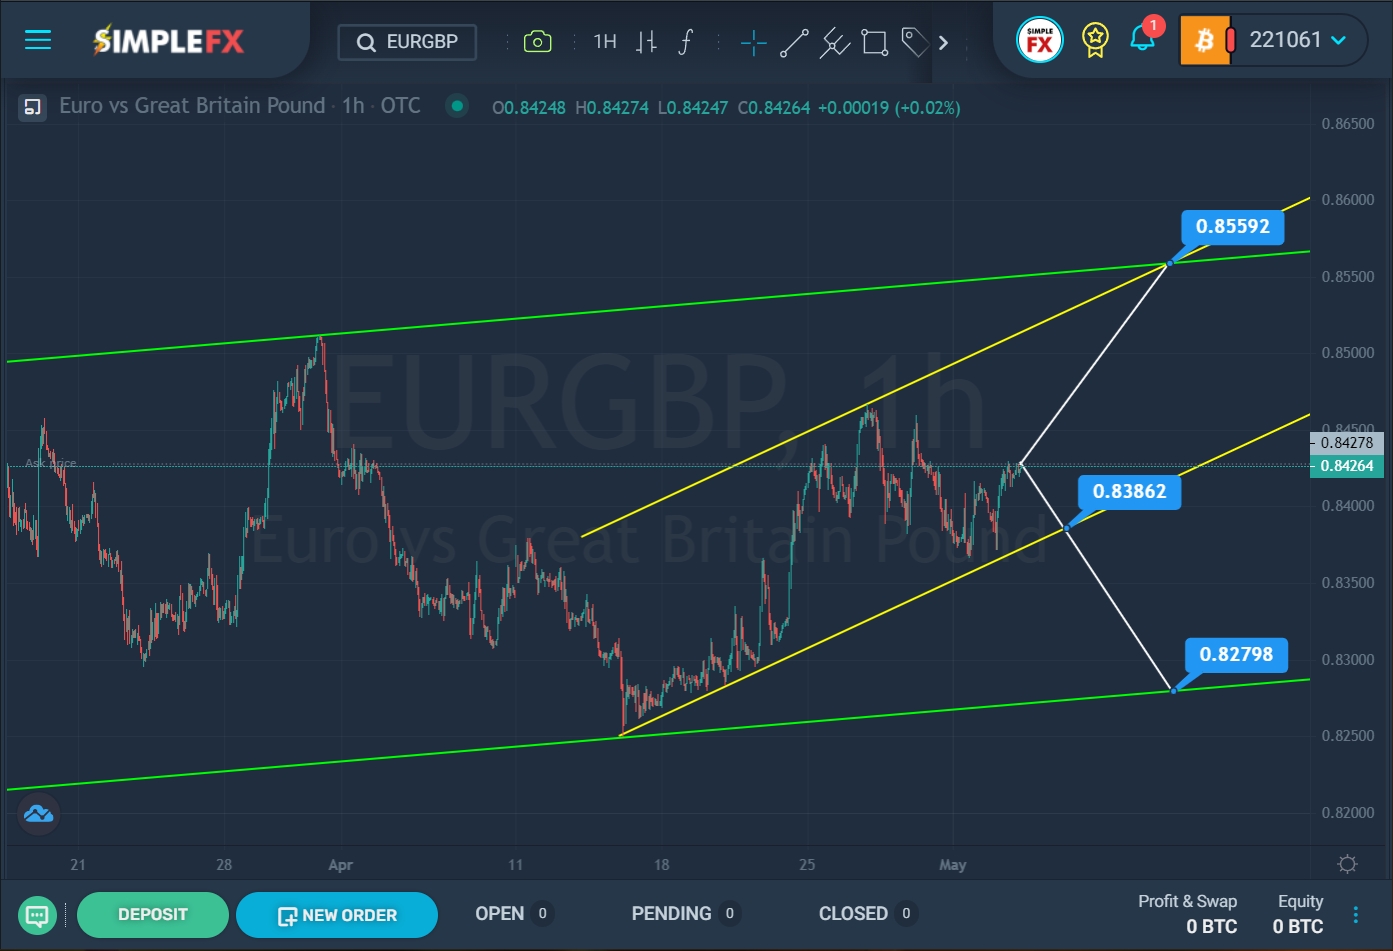
The current structure of the EURGBP currency suggests the construction of a large bullish trend that moves within the green channel.

SimpleFX EURGBP Chart Analysis: May 4, 2022.
The price touched the upper green line at the end of March, but the bulls failed to break through it; it pushed off and continued its downward movement. The price fell to the lower green line in a couple of weeks, but it went up again. The last ascending section of the chart describes a yellow channel.
Currently, the market is near the lower yellow line. There is a possibility that the bears will be able to break through the support level of 0.838. If this level is broken, market participants may expect a repeated decline to the lower green wall and the support level of 0.827.
If the lower yellow line is not broken, the price will push off from it and start moving upward. We see that there are no obstacles on the way for the bulls to the upper green line, so the bullish trend will continue to the resistance level of 0.855, which is located at the intersection of the two upper lines of the green and yellow channels.
With the market’s upward movement, it is recommended to consider opening deals for purchases. In case of a bearish trend, it is recommended to consider opening sales deals.


